Enterprise Observability
Without Enterprise Pricing
Powered by OpenTelemetry and ClickHouse. Unify your traces, metrics, and logs in a single platform that processes billions of spans for 10% of the cost of Datadog.
App Performance Monitoring
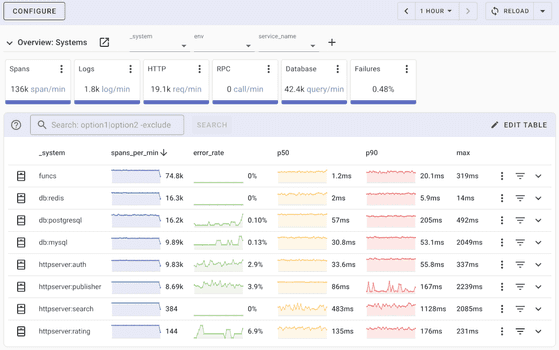
See your entire application stack at a glance. One dashboard shows you exactly what's happening across all services, hosts, and systems.
- Service graph revealing dependencies and bottlenecks.
- RED metrics: request rate, error rate, and latency.
- Latency percentiles: p50, p90, p99, and max.
- Top errors and most frequent log patterns.
- Slowest endpoints requiring attention.
Know the health of your application in seconds, not minutes.
Trusted by Engineers Worldwide
"We cut our observability costs by 80% switching from Datadog. The OpenTelemetry-native approach means no vendor lock-in, and traces load faster than our old setup ever did."
Marcus Webb
Staff Engineer, Fintech Startup
"Finally, an observability tool that doesn't require a dedicated team to manage. We went from zero visibility to full distributed tracing in under a day."
Sarah Lindqvist
VP of Engineering, Series B SaaS
"The pricing model is refreshingly honest. We know exactly what we'll pay each month, and the performance at scale has been rock solid across 200+ services."
James Okonkwo
Platform Lead, E-commerce
Deploy Your Way
Start sending data in minutes. We handle the infrastructure.
No installation required:
Create an account and start ingesting data immediately.
Key benefits
Zero ops, fully managed
Automatic scaling and updates
Predictable monthly pricing
99.9% uptime SLA
Why Uptrace?
Traces, metrics, and logs in one place. No more jumping between tools or stitching data together manually.
Ingest from OpenTelemetry, Prometheus, Vector, FluentBit, CloudWatch, and more. Works at any scale.
Self-host for free with no feature limits. Download from GitHub and own your data completely.
Prefer managed? Uptrace Cloud handles everything. Need compliance? We offer on-premise installations.
Pay per GB ingested and active timeseries. No per-seat fees, no hidden charges, no usage spikes that break your budget.
Set a monthly cap and we guarantee you'll never exceed it. Volume discounts kick in automatically.
Get started with OpenTelemetry in minutes
Transparent Infrastructure
Our Team
Based in Moldova
Our engineering team is physically located in Moldova. We're a tight-knit team building observability tools with care and attention to detail.
Infrastructure
Servers in Germany & Finland
All servers and data are physically located in EU data centers. Your telemetry data never leaves the European Union. Full GDPR compliance by design.
Egress Costs
Minimize cloud transfer fees
Sending data from AWS or GCP incurs outbound traffic fees. Observability data compresses exceptionally well with OTel Arrow protocol.
Global Latency
With megabyte-sized payloads, round-trip latency matters less than throughput. Our EU infrastructure delivers reliable ingestion worldwide.