OpenTelemetry JavaScript distro for Uptrace
Uptrace is an open-source, OpenTelemetry-native APM platform. This document explains how to configure the OpenTelemetry JavaScript SDK to export spans (traces), logs, and metrics to Uptrace using OTLP/HTTP.
Choose Your Setup Path
Option A: Node.js Applications
Best for: Server-side JavaScript, backend services, APIs
uptrace-js is a thin wrapper over opentelemetry-js that configures the OpenTelemetry SDK to export data to Uptrace. It does not add any new functionality and is provided only for your convenience.
Option B: Browser Applications
Best for: Client-side web apps, SPAs, frontend monitoring
Quick Start Guide
Follow these steps to get your first trace running in 5 minutes:
Step 1: Create an Uptrace Project
Create an Uptrace project (or self-host Uptrace) to obtain a DSN (Data Source Name), for example, https://<secret>@api.uptrace.dev?grpc=4317.
Step 2: Install @uptrace/node
npm install @uptrace/node --save
Step 3: Basic Configuration
Configure the Uptrace client using a DSN (Data Source Name) from the project settings page. Replace <FIXME> with your actual Uptrace DSN, and myservice with a name that identifies your application.
You must call configureOpentelemetry as early as possible and before importing other packages, because the OpenTelemetry SDK must patch libraries before you import them.
// The very first import must be Uptrace and/or OpenTelemetry.
const uptrace = require('@uptrace/node')
const otel = require('@opentelemetry/api')

// Start OpenTelemetry SDK and invoke instrumentations to patch the code.
const sdk = uptrace.configureOpentelemetry({
  // Copy your project DSN here or use UPTRACE_DSN env var
  //dsn: '<FIXME>',
  serviceName: 'myservice',
  serviceVersion: '1.0.0',
  deploymentEnvironment: 'production',
})
sdk.start()
Step 4: Create Your First Trace
Copy the code to main.js:
'use strict'

// The very first import must be Uptrace/OpenTelemetry.
const otel = require('@opentelemetry/api')
const uptrace = require('@uptrace/node')

// Start OpenTelemetry SDK and invoke instrumentations to patch the code.
const sdk = uptrace.configureOpentelemetry({
  // Set dsn or UPTRACE_DSN env var.
  //dsn: '<FIXME>',
  serviceName: 'myservice',
  serviceVersion: '1.0.0',
})
sdk.start()

// Create a tracer. Usually, tracer is a global variable.
const tracer = otel.trace.getTracer('app_or_package_name', '1.0.0')

// Create a root span (a trace) to measure some operation.
tracer.startActiveSpan('main-operation', (main) => {
  tracer.startActiveSpan('GET /posts/:id', (child1) => {
    child1.setAttribute('http.method', 'GET')
    child1.setAttribute('http.route', '/posts/:id')
    child1.setAttribute('http.url', 'http://localhost:8080/posts/123')
    child1.setAttribute('http.status_code', 200)
    child1.recordException(new Error('error1'))
    child1.end()
  })

  tracer.startActiveSpan('SELECT', (child2) => {
    child2.setAttribute('db.system', 'mysql')
    child2.setAttribute('db.statement', 'SELECT * FROM posts LIMIT 100')
    child2.end()
  })

  // End the span when the operation we are measuring is done.
  main.end()

  console.log(sdk.traceUrl(main))
})

setTimeout(async () => {
  // Send buffered spans and free resources.
  await sdk.shutdown()
})
Step 5: Run Your Application
Execute the example, replacing <FIXME> with your Uptrace DSN:
$ UPTRACE_DSN="<FIXME>" node main.js
https://app.uptrace.dev/traces/<trace_id>
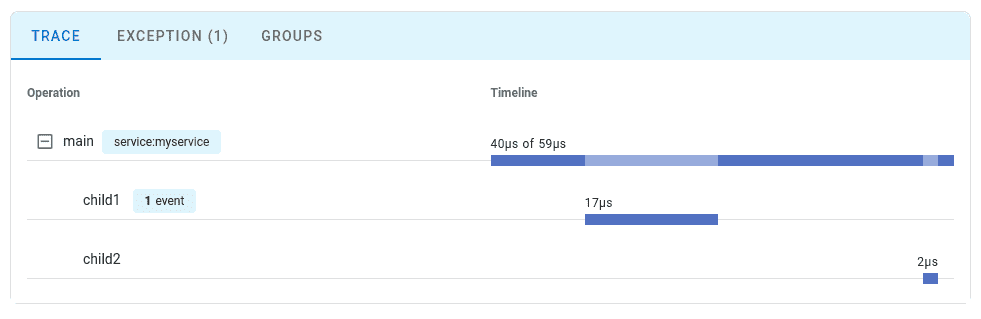
Step 6: View Your Trace
Click the generated link to view your trace in the Uptrace dashboard:
Configuration Options
You can find the full list of available options at the @uptrace/node repository.
| Option | Description |
|---|---|
dsn | A data source that specifies Uptrace project credentials. For example, https://<secret>@api.uptrace.dev?grpc=4317. |
serviceName | service.name resource attribute. For example, myservice. |
serviceVersion | service.version resource attribute. For example, 1.0.0. |
deploymentEnvironment | deployment.environment resource attribute. For example, production. |
resourceAttributes | Any other resource attributes. |
resource | Resource attributes representing an entity that produces telemetry. |
instrumentations | Custom instrumentations to register. |
What's Next?
Instrument more operations to get a detailed picture of your application. Prioritize network calls, database queries, errors, and logs.
By Use Case
| I want to... | Read this |
|---|---|
| Instrument without code changes | Zero-code instrumentation |
| Learn more about Node.js setup | Node.js SDK |
| Instrument browser applications | Browser SDK |
| Use OTLP exporter directly | Direct OTLP Configuration |
| Instrument my code with spans | Tracing API |
| Collect application metrics | Metrics API |
| Send logs to Uptrace | Logs integration |
| Enable distributed tracing | Context propagation |
| Reduce costs in production | Sampling strategies |
| Auto-detect cloud environment | Resource detectors |