OpenTelemetry .NET distro for Uptrace
Uptrace is an open-source, OpenTelemetry-native APM platform. This guide shows you how to configure the OpenTelemetry .NET SDK to export spans, logs, and metrics to Uptrace using the OTLP/HTTP protocol.
Choose Your Setup Path
Option A: Quick Start with uptrace-dotnet (Recommended)
Best for: Getting started quickly, automatic configuration
uptrace-dotnet is a lightweight wrapper around opentelemetry-dotnet that pre-configures the OpenTelemetry SDK to export data to Uptrace. It doesn't add new functionality but simplifies the setup process for your convenience.
dotnet add package Uptrace.OpenTelemetry --prerelease
Option B: Direct OTLP Configuration
Best for: Existing OpenTelemetry users, custom exporters, fine-grained control
Quick Start Guide
Follow these steps to get your first trace running in 5 minutes:
Step 1: Create an Uptrace Project
Create an Uptrace project (or self-host Uptrace) to obtain a DSN (Data Source Name), for example, https://<secret>@api.uptrace.dev?grpc=4317.
Step 2: Install uptrace-dotnet
dotnet add package Uptrace.OpenTelemetry --prerelease
Step 3: Basic Configuration
Configure the Uptrace client using a DSN (Data Source Name) from your project settings page. Replace <FIXME> with your actual Uptrace DSN and myservice with a name that identifies your application.
using System;
using System.Diagnostics;

using OpenTelemetry;
using OpenTelemetry.Trace;
using OpenTelemetry.Resources;

using Uptrace.OpenTelemetry;

var serviceName = "myservice";
var serviceVersion = "1.0.0";

using var tracerProvider = Sdk.CreateTracerProviderBuilder()
    .AddSource(serviceName) // For custom spans
    .SetResourceBuilder(
        ResourceBuilder
            .CreateDefault()
            .AddEnvironmentVariableDetector()
            .AddTelemetrySdk()
            .AddService(serviceName: serviceName, serviceVersion: serviceVersion)
    )
    .AddAspNetCoreInstrumentation() // Automatic HTTP server spans
    .AddHttpClientInstrumentation() // Automatic HTTP client spans
    // Copy your project DSN here or use UPTRACE_DSN env var
    //.AddUptrace("<FIXME>")
    .AddUptrace()
    .Build();
For the instrumentation to work, install these additional packages:
dotnet add package OpenTelemetry.Instrumentation.AspNetCore
dotnet add package OpenTelemetry.Instrumentation.Http
Step 4: Run the Complete Example
Clone the basic example to get a ready-to-run application:
git clone https://github.com/uptrace/uptrace-dotnet.git
cd uptrace-dotnet/example/basic
Step 5: Run Your Application
Execute your application, replacing <FIXME> with your Uptrace DSN:
UPTRACE_DSN="<FIXME>" dotnet run
You should see output similar to:
https://app.uptrace.dev/traces/<trace_id>
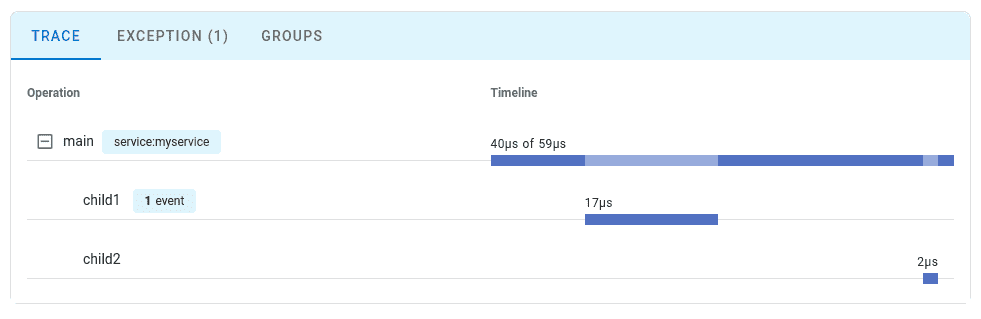
Step 6: View Your Trace
Click the generated link to view your trace in the Uptrace dashboard:
Configuration Options
Use these settings when configuring resources and the Uptrace exporter:
| Setting | Where to configure | Description |
|---|---|---|
UPTRACE_DSN | AddUptrace("<DSN>") or environment variable | A data source that specifies Uptrace project credentials. |
service.name | AddService(serviceName: ...) or OTEL_SERVICE_NAME | The service name shown in Uptrace. |
service.version | AddService(..., serviceVersion: ...) | The service version for deployments. |
deployment.environment | AddAttributes(...) or OTEL_RESOURCE_ATTRIBUTES | The environment (production, staging). |
| Resource attributes | AddAttributes(...) or OTEL_RESOURCE_ATTRIBUTES | Additional metadata like service.namespace or team.name. |
| Resource detectors | AddEnvironmentVariableDetector() | Reads resource attributes from environment variables. |
ASP.NET Core Configuration
For ASP.NET Core applications, use the modern AddOpenTelemetry() extension method which provides a cleaner configuration experience:
using OpenTelemetry.Exporter;
using OpenTelemetry.Logs;
using OpenTelemetry.Metrics;
using OpenTelemetry.Resources;
using OpenTelemetry.Trace;

var serviceName = "myservice";
var serviceVersion = "1.0.0";

var builder = WebApplication.CreateBuilder(args);

builder.Services.AddOpenTelemetry()
    .ConfigureResource(resource => resource
        .AddService(serviceName: serviceName, serviceVersion: serviceVersion)
        .AddAttributes(new Dictionary<string, object>
        {
            ["deployment.environment"] = builder.Environment.EnvironmentName
        }))
    .WithTracing(tracing => tracing
        .AddSource(serviceName)
        .AddAspNetCoreInstrumentation()
        .AddHttpClientInstrumentation()
        .AddOtlpExporter(options =>
        {
            options.Endpoint = new Uri("https://api.uptrace.dev/v1/traces");
            options.Headers = $"uptrace-dsn={Environment.GetEnvironmentVariable("UPTRACE_DSN")}";
            options.Protocol = OtlpExportProtocol.HttpProtobuf;
        }))
    .WithMetrics(metrics => metrics
        .AddMeter(serviceName)
        .AddAspNetCoreInstrumentation()
        .AddHttpClientInstrumentation()
        .AddOtlpExporter(options =>
        {
            options.Endpoint = new Uri("https://api.uptrace.dev/v1/metrics");
            options.Headers = $"uptrace-dsn={Environment.GetEnvironmentVariable("UPTRACE_DSN")}";
            options.Protocol = OtlpExportProtocol.HttpProtobuf;
        }));

builder.Logging.AddOpenTelemetry(logging =>
{
    logging.SetResourceBuilder(ResourceBuilder.CreateDefault()
        .AddService(serviceName: serviceName, serviceVersion: serviceVersion)
        .AddAttributes(new Dictionary<string, object>
        {
            ["deployment.environment"] = builder.Environment.EnvironmentName
        }));
    logging.IncludeFormattedMessage = true;
    logging.IncludeScopes = true;
    logging.AddOtlpExporter(options =>
    {
        options.Endpoint = new Uri("https://api.uptrace.dev/v1/logs");
        options.Headers = $"uptrace-dsn={Environment.GetEnvironmentVariable("UPTRACE_DSN")}";
        options.Protocol = OtlpExportProtocol.HttpProtobuf;
    });
});

builder.Services.AddControllers();

var app = builder.Build();
app.MapControllers();
app.Run();
Required NuGet Packages
Install the following packages for ASP.NET Core:
dotnet add package OpenTelemetry.Extensions.Hosting
dotnet add package OpenTelemetry.Exporter.OpenTelemetryProtocol
dotnet add package OpenTelemetry.Instrumentation.AspNetCore
dotnet add package OpenTelemetry.Instrumentation.Http
Error Monitoring
To monitor errors with exception details, use the RecordException method on an Activity:
using System;
using System.Diagnostics;

var activitySource = new ActivitySource("app_or_package_name");

using var activity = activitySource.StartActivity("operation-name");

try
{
    // Your code that might throw
    throw new InvalidOperationException("Something went wrong");
}
catch (Exception ex)
{
    activity?.RecordException(ex);
    activity?.SetStatus(ActivityStatusCode.Error, ex.Message);
    throw;
}
This records the exception as a span event with the following attributes:
exception.typeexception.messageexception.stacktrace
ASP.NET Core Automatic Exception Recording
For ASP.NET Core applications, you can enable automatic exception recording using the instrumentation options:
using OpenTelemetry;
using OpenTelemetry.Trace;

var tracerProvider = Sdk.CreateTracerProviderBuilder()
    .AddAspNetCoreInstrumentation(options =>
    {
        options.RecordException = true;
    })
    .AddOtlpExporter()
    .Build();
When RecordException is enabled, unhandled exceptions in your ASP.NET Core application are automatically recorded as span events with full exception details.
See OpenTelemetry .NET Tracing API for more details.
Resource Configuration
Resources provide metadata about the entity producing telemetry. You can configure resources using environment variables or in code.
Using Environment Variables
Use the OTEL_RESOURCE_ATTRIBUTES environment variable to inject resource attributes:
export OTEL_SERVICE_NAME="myservice"
export OTEL_RESOURCE_ATTRIBUTES="service.version=1.0.0,deployment.environment=production,team.name=backend"
The .NET SDK automatically detects these environment variables when you use AddEnvironmentVariableDetector():
var resourceBuilder = ResourceBuilder
    .CreateDefault()
    .AddEnvironmentVariableDetector()
    .AddTelemetrySdk();
Using Code
Add custom resource attributes programmatically:
using OpenTelemetry.Resources;

var resourceBuilder = ResourceBuilder
    .CreateDefault()
    .AddService(serviceName: "myservice", serviceVersion: "1.0.0")
    .AddAttributes(new Dictionary<string, object>
    {
        ["deployment.environment"] = "production",
        ["team.name"] = "backend",
        ["service.namespace"] = "my-namespace"
    });
Common resource attributes include:
| Attribute | Description |
|---|---|
service.name | The name of the service |
service.version | The version of the service |
service.namespace | A namespace for the service |
service.instance.id | Unique identifier for the service instance |
deployment.environment | The deployment environment (production, staging) |
host.name | The hostname |
Troubleshooting
If you encounter issues with OpenTelemetry .NET, try these troubleshooting guides:
Common Issues
No data appearing in Uptrace:
- Verify your DSN is correctly configured
- Check that your application is generating spans/metrics
- Ensure network connectivity to Uptrace endpoints
Performance issues:
- Adjust sampling rates if collecting too much data
- Review instrumentation configuration for unnecessary overhead
What's Next?
Instrument more operations to get a detailed picture of your application. Prioritize network calls, database queries, errors, and logs.
By Use Case
| I want to... | Read this |
|---|---|
| Instrument without code changes | Zero-code instrumentation |
| Instrument my code with spans | OpenTelemetry .NET Tracing API |
| Collect application metrics | OpenTelemetry .NET Metrics API |
| Send logs to Uptrace | OpenTelemetry .NET Logs |
| Enable distributed tracing | OpenTelemetry .NET Context Propagation |
| Reduce costs in production | OpenTelemetry .NET Sampling |
| Auto-detect cloud environment | OpenTelemetry .NET Resource detectors |