Jaeger vs Prometheus [2025 comparison]
Jaeger and Prometheus are both popular open source monitoring systems, but they serve different purposes and focus on different aspects of observability in a distributed system.
Learn how these tools are similar, how they're different, and when you should use each one.
Jaeger
Jaeger is a project within OpenTelemetry ecosystem that is often used as the default OpenTelemetry backend for storing, analyzing, and visualizing telemetry data.
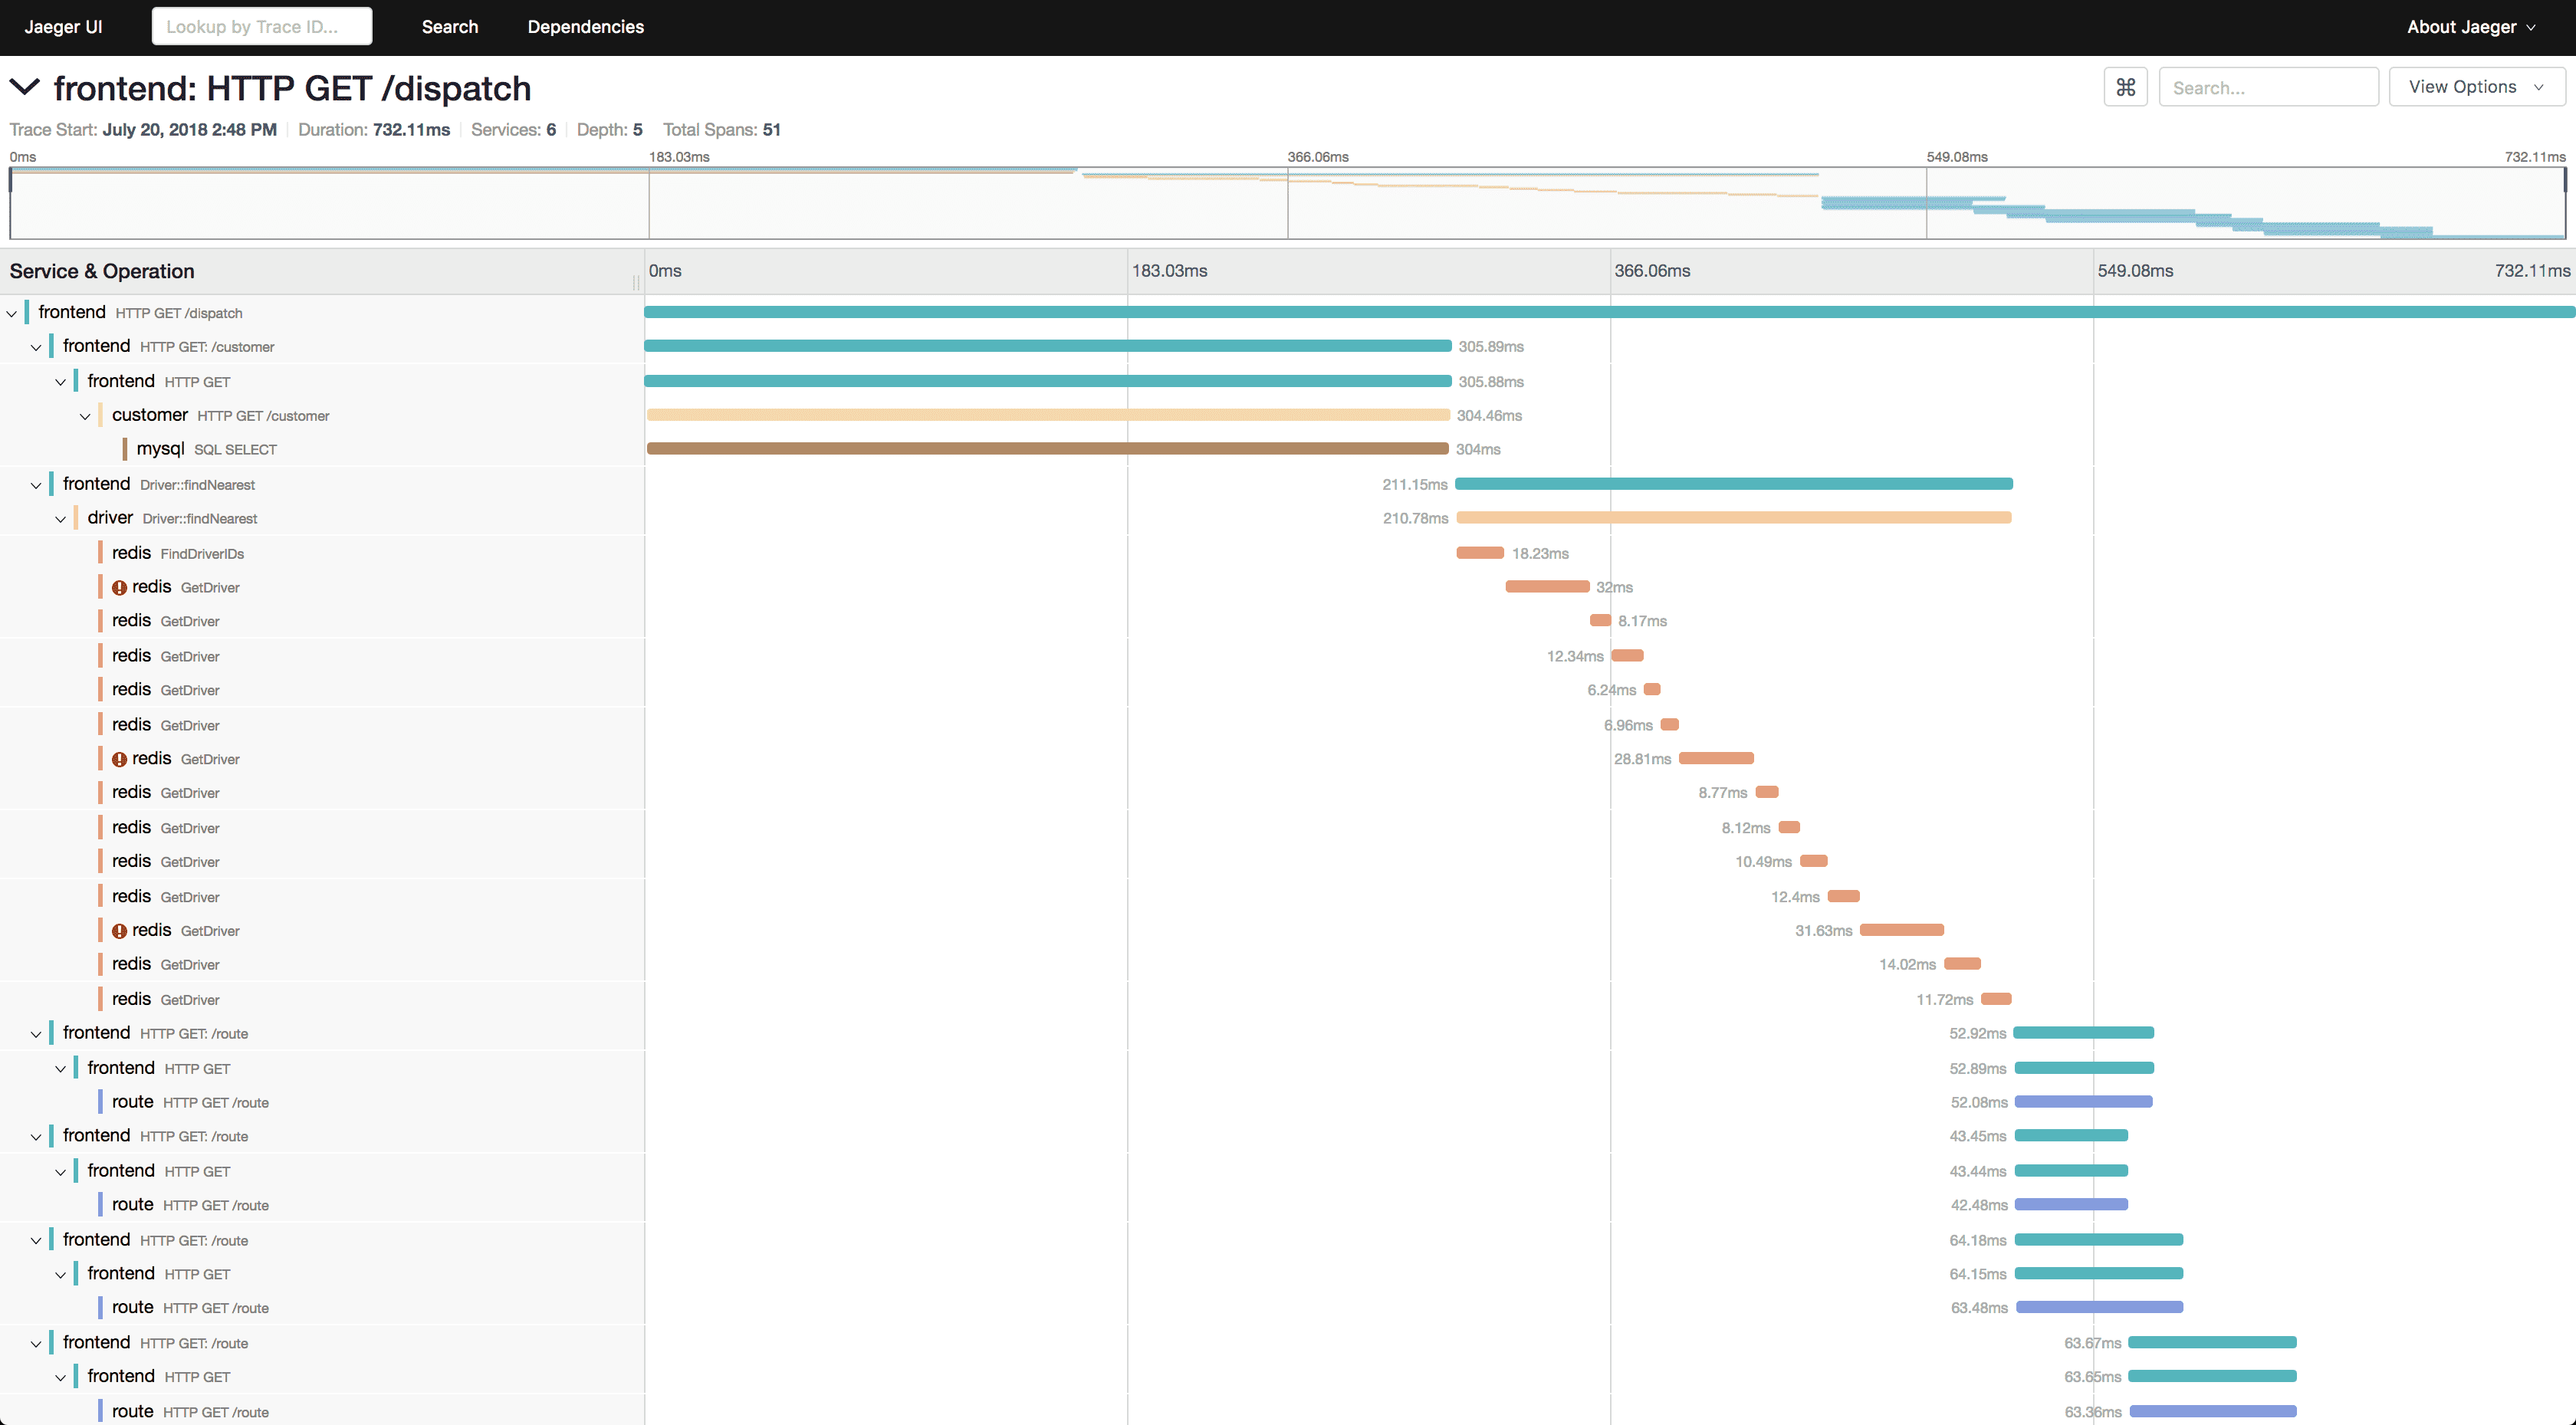
Jaeger use OpenTelemetry to capture timing and tracing data, known as spans, from different parts of an application and aggregates them to provide a comprehensive view of the system's behavior.
Jaeger collects and stores trace data so you can visualize and analyze the performance of your applications, identify bottlenecks, and diagnose problems.
Jaeger also supports several advanced features, such as adaptive sampling, which allows users to control the amount of trace data collected to reduce overhead.
Prometheus
Prometheus is an open-source monitoring and alerting system designed for time-series data. It is widely used in the field of cloud-native and containerized environments for monitoring applications and infrastructure.
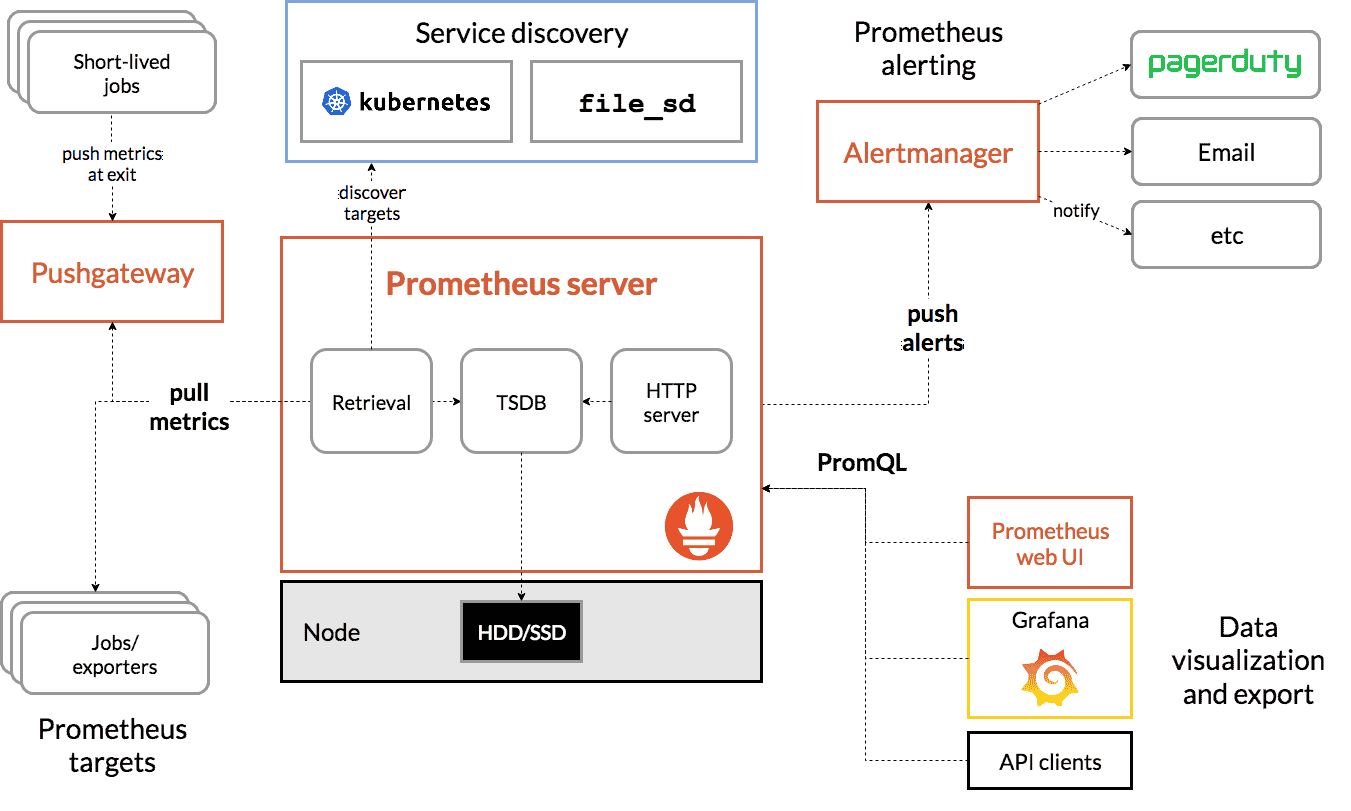
Prometheus has become a popular choice for monitoring modern infrastructure due to its simplicity, flexibility, and active community support. It is widely adopted by organizations and integrates well with various ecosystems, making it a fundamental component of many monitoring and observability setups. For users looking to combine the strengths of both systems, learn how to set up Prometheus and OpenTelemetry integration.
Jaeger vs Prometheus: differences
Jaeger is primarily a distributed tracing tool, focusing on capturing and analyzing the flow of requests within a distributed system. It provides detailed insights into request latency, dependencies, and performance bottlenecks.
Prometheus, on the other hand, is a monitoring and alerting system that collects and analyzes time-series metrics data related to various aspects of the system, such as CPU usage, memory usage, and request latency.
Jaeger provides a web interface for distributed traces visualization, allowing users to explore the flow of requests and identify performance issues.
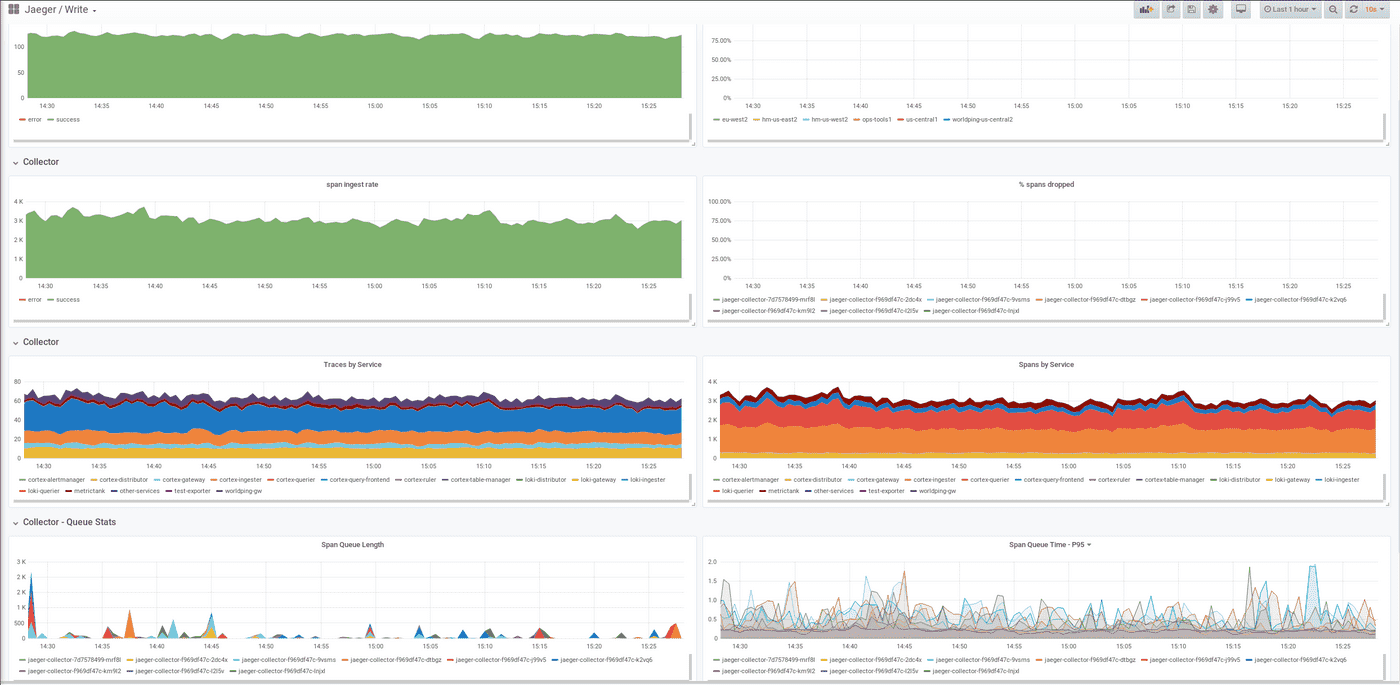
Prometheus offers limited visualization capabilities, but it can be easily integrated with visualization tools like Grafana, which provide comprehensive dashboarding and visualization options. Prometheus is also supported by many Grafana alternatives.
Using Jaeger and Prometheus together
Jaeger and Prometheus can be used together to complement each other's capabilities and provide a comprehensive observability solution for a distributed system.
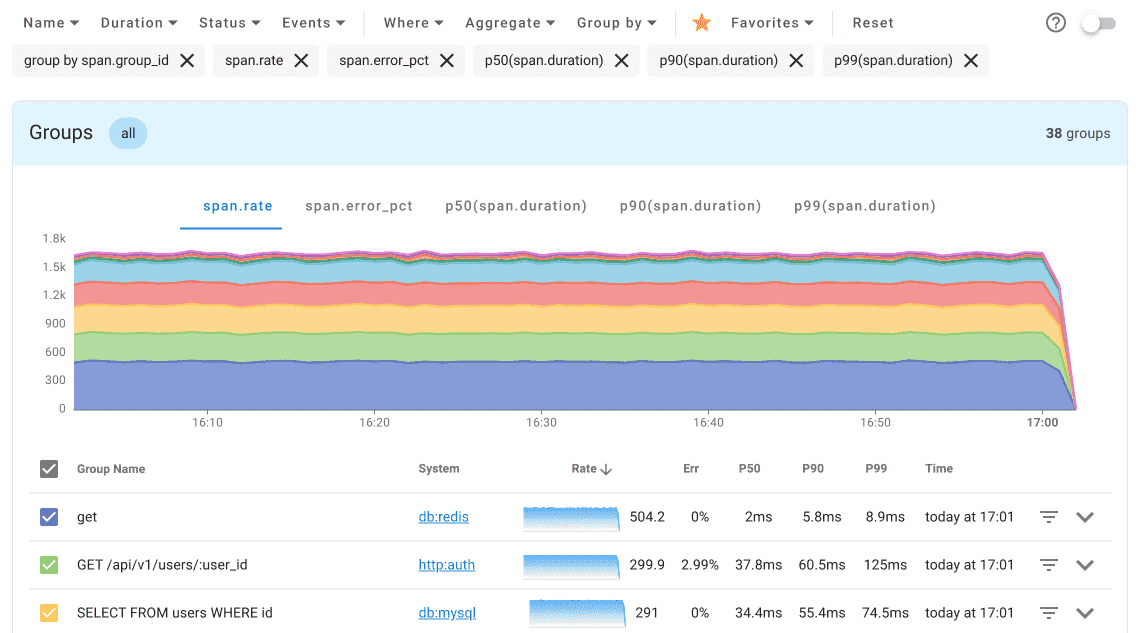
By combining the tracing data from Jaeger with metrics data from Prometheus, you can achieve end-to-end observability, gaining insights into both the behavior and performance of your system.
By integrating Jaeger and Prometheus, you can correlate metrics data with traces. For example, if you observe a spike in latency in Prometheus, you can drill down into the associated traces in Jaeger to identify the root cause of the issue.
While Jaeger provides a basic web interface for trace visualization, it may not offer advanced visualization features. By integrating Jaeger and Prometheus with visualization tools like Grafana, you can create comprehensive dashboards that combine metrics and trace data.
What is the alternative to Jaeger and Prometheus?
OpenTelemetry offers the flexibility to select the desired backend for storing and analyzing trace data, providing freedom in choice. While Jaeger and Prometheus are widely adopted, OpenTelemetry allows users to leverage various backends according to their specific requirements and preferences.
Uptrace is an OpenTelemetry APM which offers a unified view of traces, metrics, and logs, allowing you to monitor, troubleshoot, and optimize your distributed systems. You can use it as an alternative to Jaeger and Prometheus.
Uptrace uses ClickHouse database to store the collected telemetry data. You can use it to monitor applications and set up automatic alerts to receive notifications via email, Slack, Telegram, and more. Additionally, Uptrace supports ingesting Prometheus metrics, enabling seamless integration of existing Prometheus metrics into a centralized monitoring platform.
Conclusion
Jaeger and Prometheus are complementary tools that address different aspects of observability in a distributed system.
Jaeger specializes in capturing and analyzing distributed traces, offering detailed performance insights.
Meanwhile, Prometheus excels in collecting and analyzing time-series metrics data, enabling system monitoring and alerting.
Together, these tools can create a powerful combination, providing a comprehensive understanding of the behavior and performance of a distributed system.
FAQ
- What are the key differences between Jaeger and Prometheus? Jaeger specializes in distributed tracing, helping track request flows through microservices, while Prometheus focuses on collecting and analyzing time-series metrics data for system monitoring and alerting.
- Can Jaeger and Prometheus be used together effectively? Yes, they complement each other perfectly. Jaeger provides detailed request tracing and service dependency insights, while Prometheus handles metrics collection and alerting. Together, they create a comprehensive observability solution.
- How do they handle data storage differently? Jaeger stores trace data in databases like Cassandra or Elasticsearch and supports sampling to manage volume. Prometheus uses its own time-series database optimized for metrics and supports both local and remote storage options.
- What about scalability in production environments? Both tools scale differently. Jaeger scales horizontally through its microservices architecture and supports adaptive sampling. Prometheus handles high volumes of metrics and offers federation for large deployments, though it may require remote storage solutions for massive scale.
- How do their visualization capabilities compare? Jaeger provides a built-in web UI specifically designed for trace visualization and analysis. Prometheus offers a basic web UI but is commonly integrated with Grafana for advanced visualization capabilities. Both can be used with Grafana for unified dashboarding.
- What are the setup and maintenance requirements? Jaeger requires OpenTelemetry instrumentation, storage configuration, and sampling strategy setup. Prometheus needs exporter configuration, metrics endpoint setup, and alert rules definition. Both benefit from container orchestration platforms for deployment.
- Is there an alternative that combines both functionalities? Yes, tools like Uptrace offer unified observability with both tracing and metrics capabilities. It uses ClickHouse for storage and supports OpenTelemetry, providing a single platform for monitoring and troubleshooting distributed systems.
- How well do they integrate with cloud-native applications? Both tools are cloud-native friendly. Jaeger offers native Kubernetes support and OpenTelemetry compatibility, while Prometheus, as a CNCF graduated project, provides strong Kubernetes integration and dynamic service discovery.
You may also be interested in: