Best 16 Application Performance Monitoring Tools & Software 2026
What is Application Performance Monitoring?
Application Performance Monitoring (APM) tracks response times, error rates, and transaction flows from the end-user perspective. Unlike infrastructure monitoring which focuses on servers and hardware, APM tools give visibility into application-level behavior — which code path is slow, which service is failing, which database query is causing latency.
Modern APM tools instrument applications via language agents or OpenTelemetry SDKs, then correlate traces, metrics, and logs to surface root causes. Most teams pair APM with infrastructure monitoring solutions for complete stack visibility.
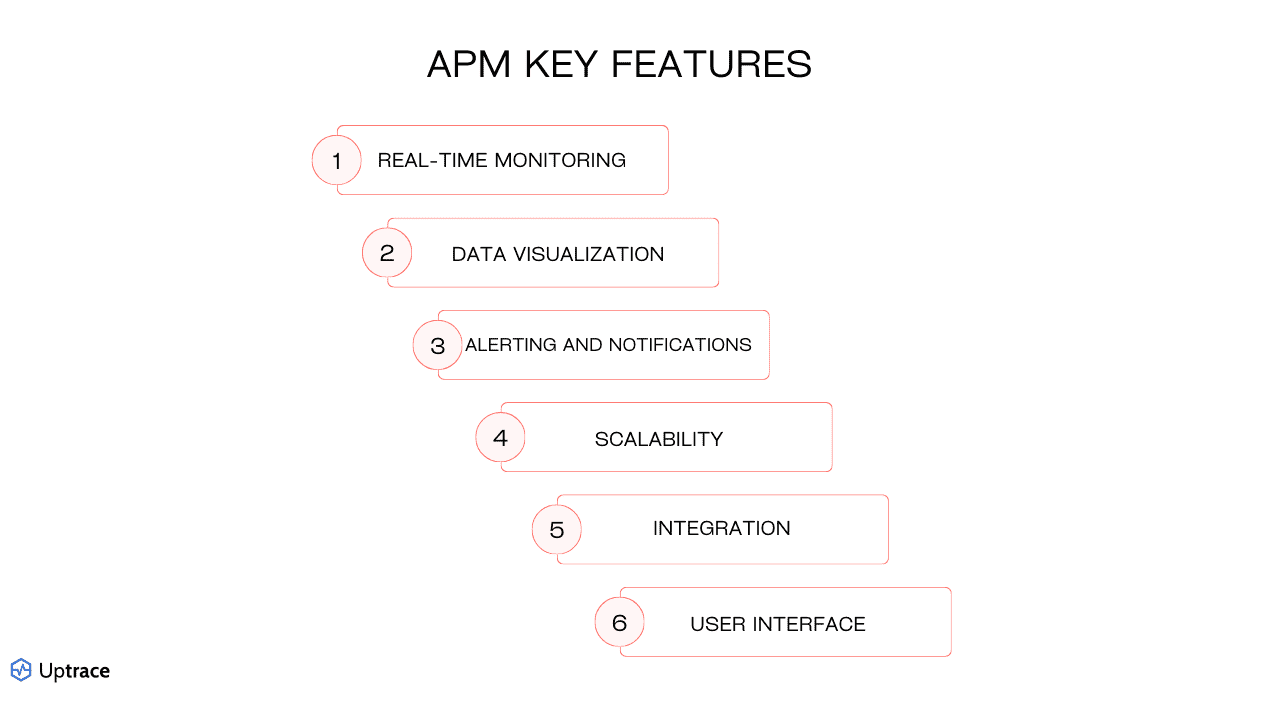
What to look for:
- Distributed tracing — end-to-end request visibility across microservices
- Error tracking — root cause analysis with stack traces and deployment context
- Real User Monitoring (RUM) — actual end-user experience data, not synthetic tests
- AI-powered anomaly detection — proactive issue identification without manual thresholds
- OpenTelemetry support — vendor-neutral instrumentation standard, now adopted by nearly half of all organizations
- Language and framework support — agents for Java, Python, .NET, Go, Node.js, Ruby, PHP
Quick Comparison
| Tool | Type | License | Best For | Deployment | Price |
|---|---|---|---|---|---|
| Uptrace | Open Source | AGPL/Commercial | Unified traces+metrics+logs | Cloud/On-Premise | Free/Custom |
| New Relic | Commercial | Proprietary | Comprehensive APM + UX monitoring | Cloud | Free tier/from $10/user/month |
| Dynatrace | Commercial | Proprietary | AI-powered enterprise monitoring | Cloud/On-Premise | Custom/Enterprise |
| Splunk AppDynamics | Commercial | Proprietary | Business transaction monitoring | Cloud/On-Premise | Custom/Enterprise |
| Datadog | Commercial | Proprietary | Cloud-native environments | Cloud | $15/host/month |
| Elastic APM | Open Source | Elastic Lic. 2 | ELK Stack environments | Cloud/On-Premise | Free/Paid |
| Splunk APM | Commercial | Proprietary | Large-scale data analytics | Cloud/On-Premise | Custom/Enterprise |
| AppSignal | Commercial | Proprietary | Ruby/Elixir/Node.js teams | Cloud | Free/from $23.25/month |
| Scout APM | Commercial | Proprietary | Ruby and Python applications | Cloud | Free/from $19/month |
| SolarWinds APM | Commercial | Proprietary | Traditional IT environments | Cloud/On-Premise | From $7/node/month |
| Raygun | Commercial | Proprietary | Error tracking + RUM | Cloud | From $40/month |
| ManageEngine | Commercial | Proprietary | Cost-effective legacy monitoring | Cloud/On-Premise | $945/year |
| highlight.io | Open Source | Apache 2.0 | Full-stack web monitoring | Cloud/On-Premise | Free/Paid |
| Scouter | Open Source | Apache 2.0 | Java/JVM applications | On-Premise | Free |
| Instana | Commercial | Proprietary | Auto-discovery, microservices | Cloud/On-Premise | Custom/Enterprise |
| Sentry | Open Source | MIT/Commercial | Error tracking + APM | Cloud/On-Premise | Free/$26/month |
Top 16 Application Performance Monitoring Tools
With numerous APM tools on the market, it can be challenging to determine which application monitoring software is right for your needs. Below, we'll dive into the top 16 APM solutions, offering comprehensive reviews to help you identify the best fit for your application monitoring requirements.
Uptrace
Uptrace is an open-source APM tool built on ClickHouse, designed for modern distributed systems. It provides distributed tracing, metrics, and logs in a single platform with OpenTelemetry-native architecture and transparent pricing.
Best for scale-up companies and engineering teams for cost-effective observability
- Free open-source version available (self-hosted, AGPL)
- Transparent flexible pricing
- Visit Website ›
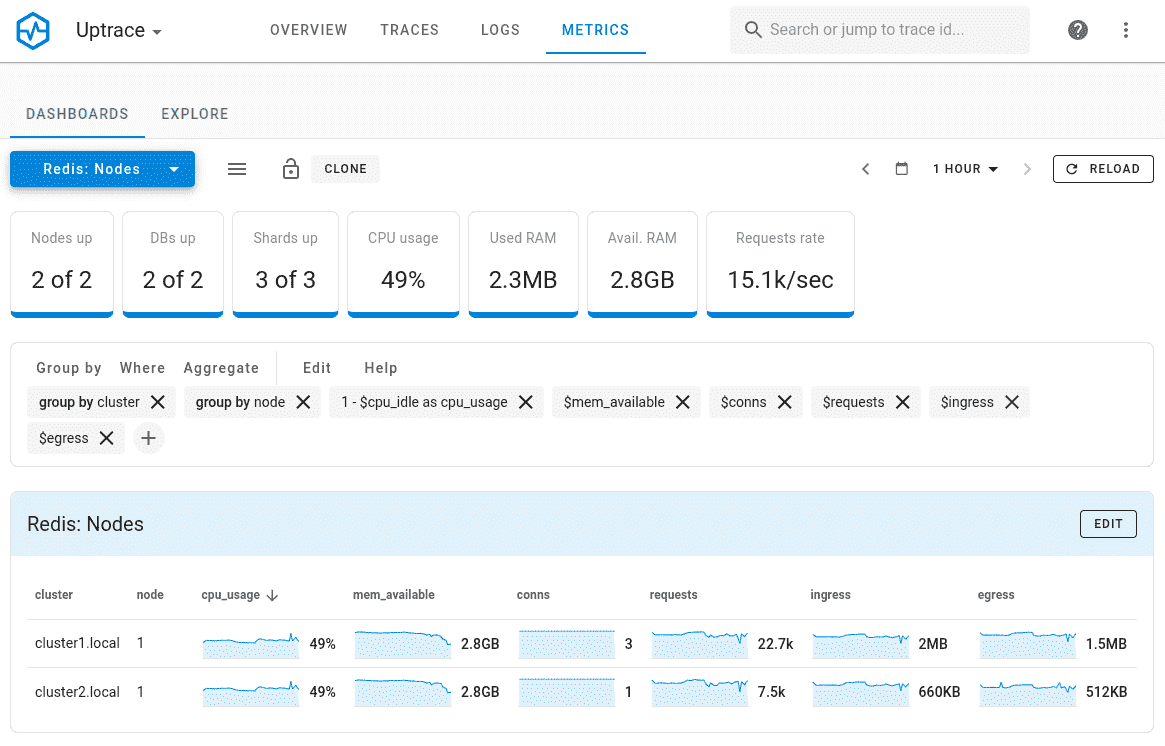
Why Choose Uptrace: Uptrace is built on ClickHouse — a columnar database optimized for fast aggregations — which enables sub-second queries over billions of spans and log lines without the cost overhead of traditional time-series databases. The platform is OpenTelemetry-native: no proprietary agents, no vendor SDK lock-in. A single deployment covers distributed traces, metrics, and logs in one interface, making it a cost-effective alternative to Datadog or New Relic for teams that want full observability without per-host or per-user pricing.
Standout Features: Unified traces, metrics, and logs correlated in a single platform. ClickHouse backend delivers fast queries even on high-cardinality data. OpenTelemetry-native architecture accepts any OTel-compatible instrumentation without modifications. Self-hosted version is free and open-source (AGPL); cloud pricing is usage-based with no fixed tiers.
Integrations: Native OpenTelemetry Protocol (OTLP) support — works with any OTel SDK across Java, Python, Go, .NET, Node.js, Ruby, and more. No custom agents required. Direct integration with Prometheus, Grafana, and popular cloud platforms.
New Relic
Best for comprehensive application monitoring
- Free tier (100GB/month, 1 full platform user included)
- From $10/first user/month; additional full platform users $99/month
- Visit Website ›
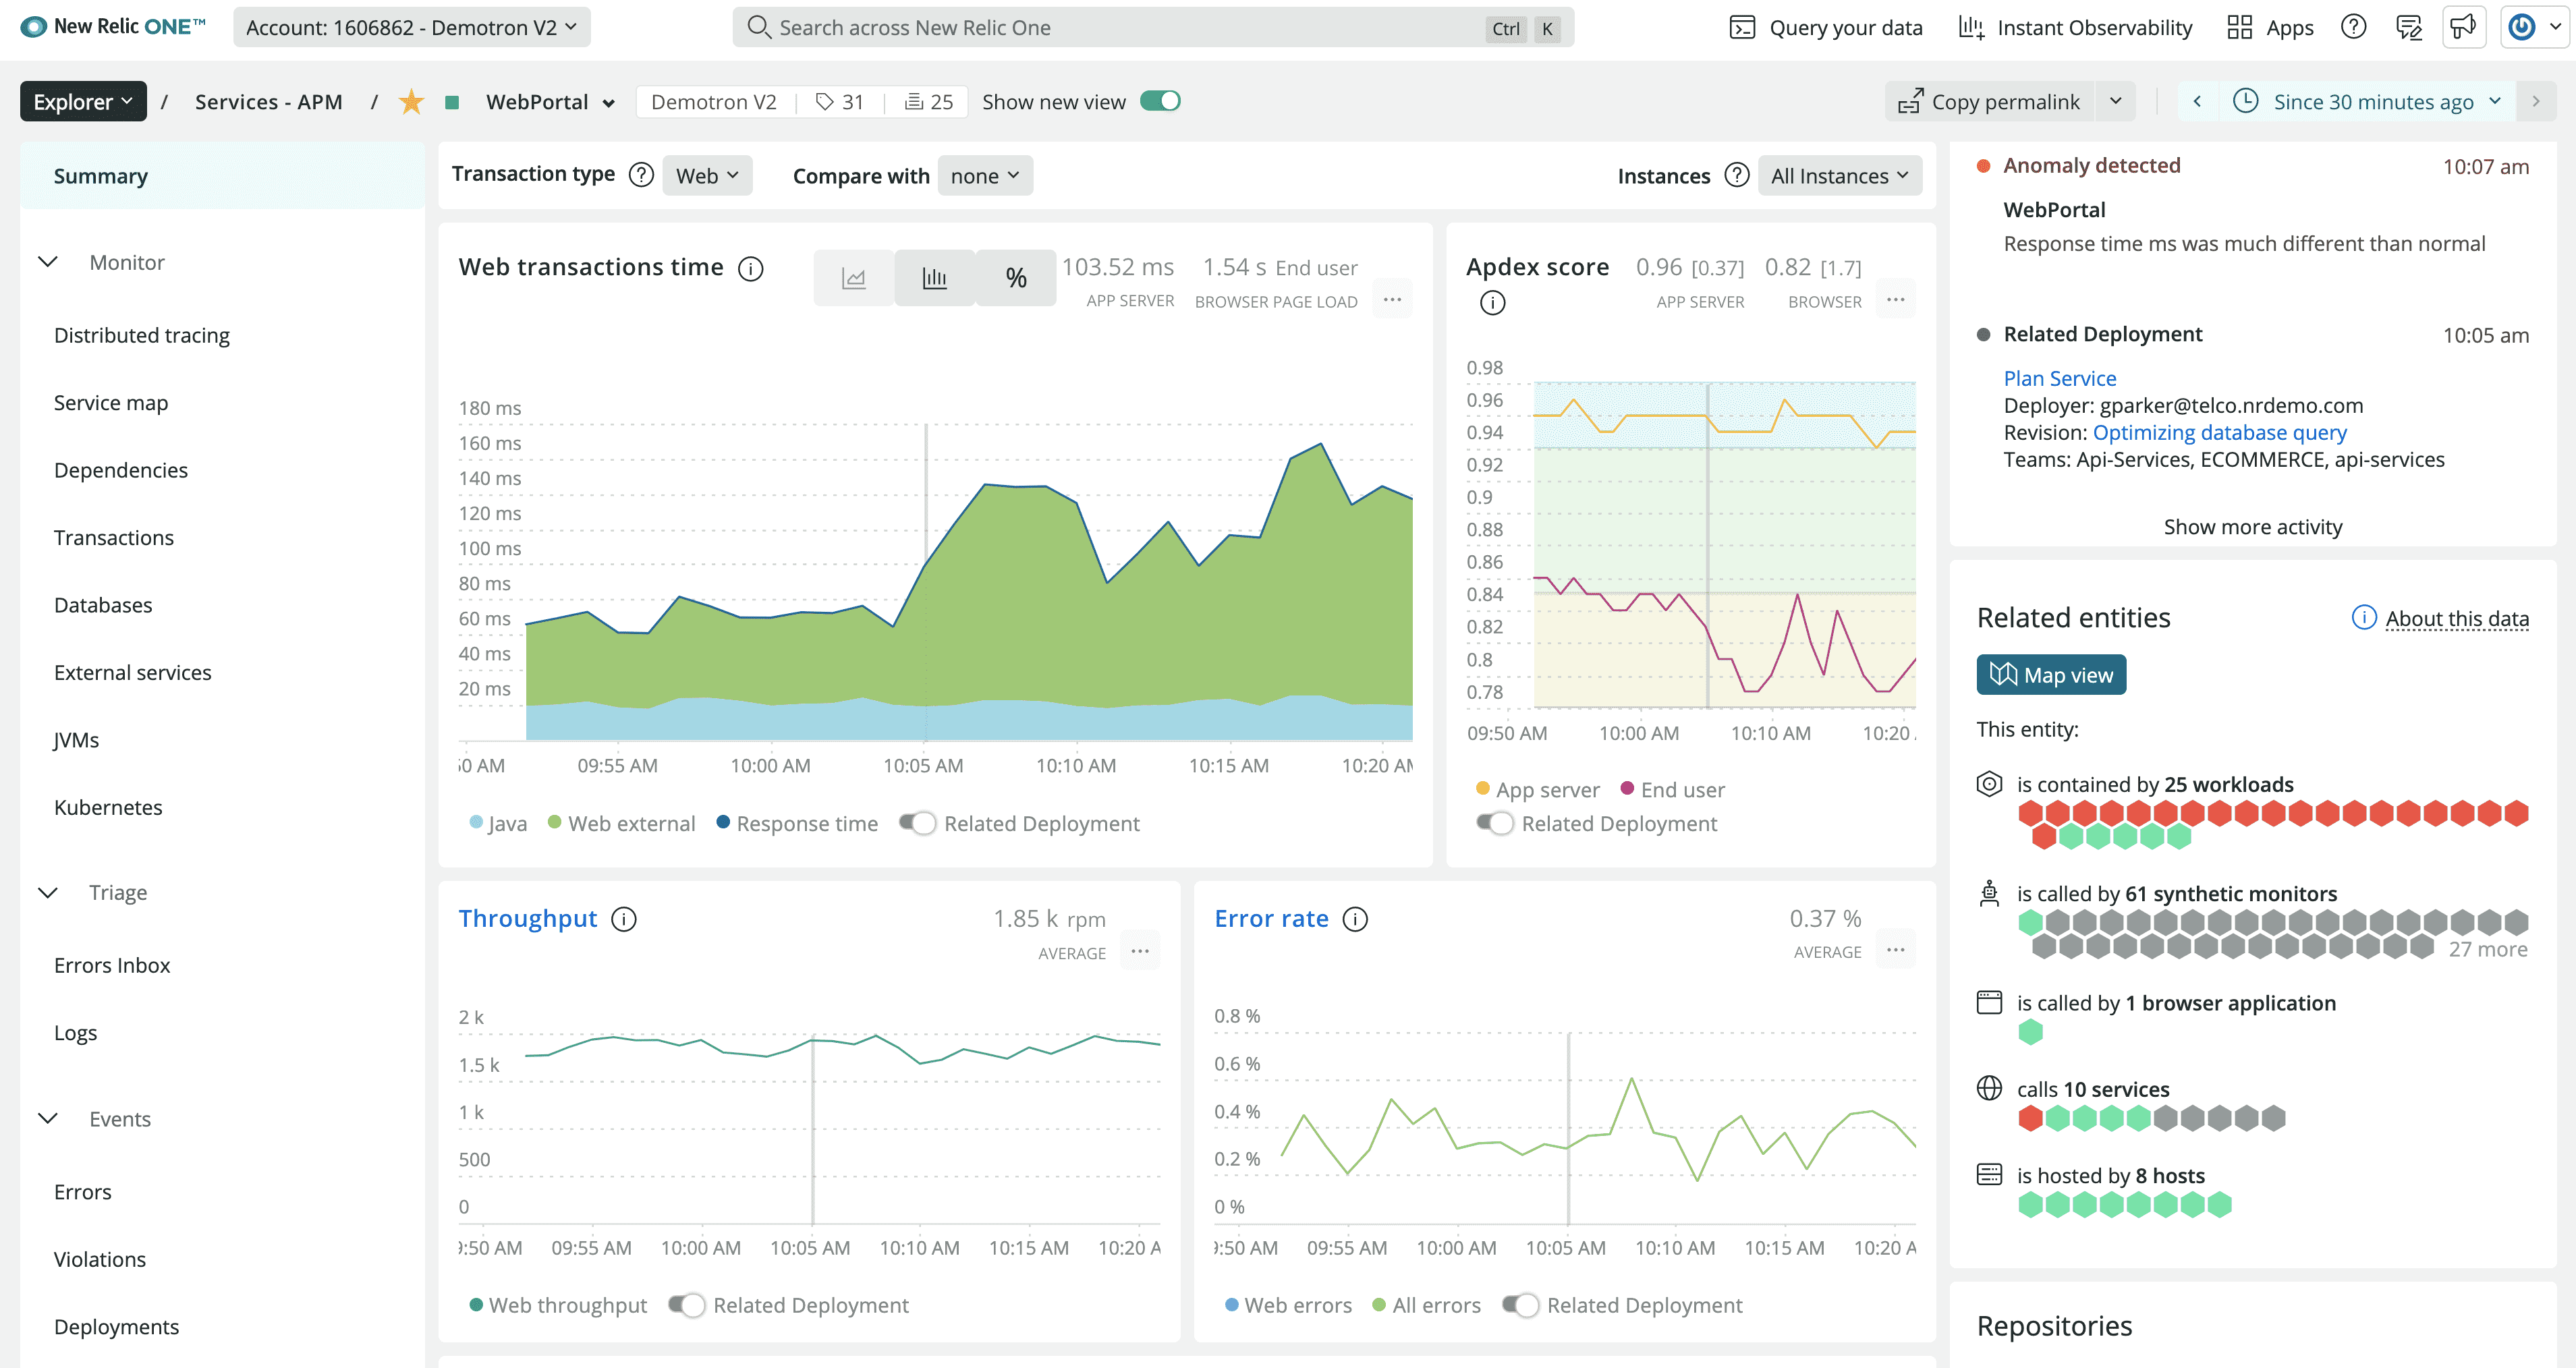
Why Choose New Relic: New Relic provides comprehensive application performance monitoring with strong focus on user experience and business metrics. The platform offers unified visibility across applications, infrastructure, and digital customer experiences, making it particularly effective for organizations requiring end-to-end observability.
Standout Features: Advanced user experience monitoring with detailed session analysis and conversion tracking. Powerful querying capabilities through NRQL (New Relic Query Language) enable custom analysis and reporting. The platform includes AI-powered insights and automated anomaly detection for proactive issue identification.
Integrations: Extensive integration ecosystem supports major programming languages, frameworks, and cloud platforms. Strong DevOps tool integration including CI/CD pipelines and incident management systems.
Dynatrace
Best for AI-powered monitoring
- 15-day free trial
- Custom enterprise pricing
- Visit Website ›
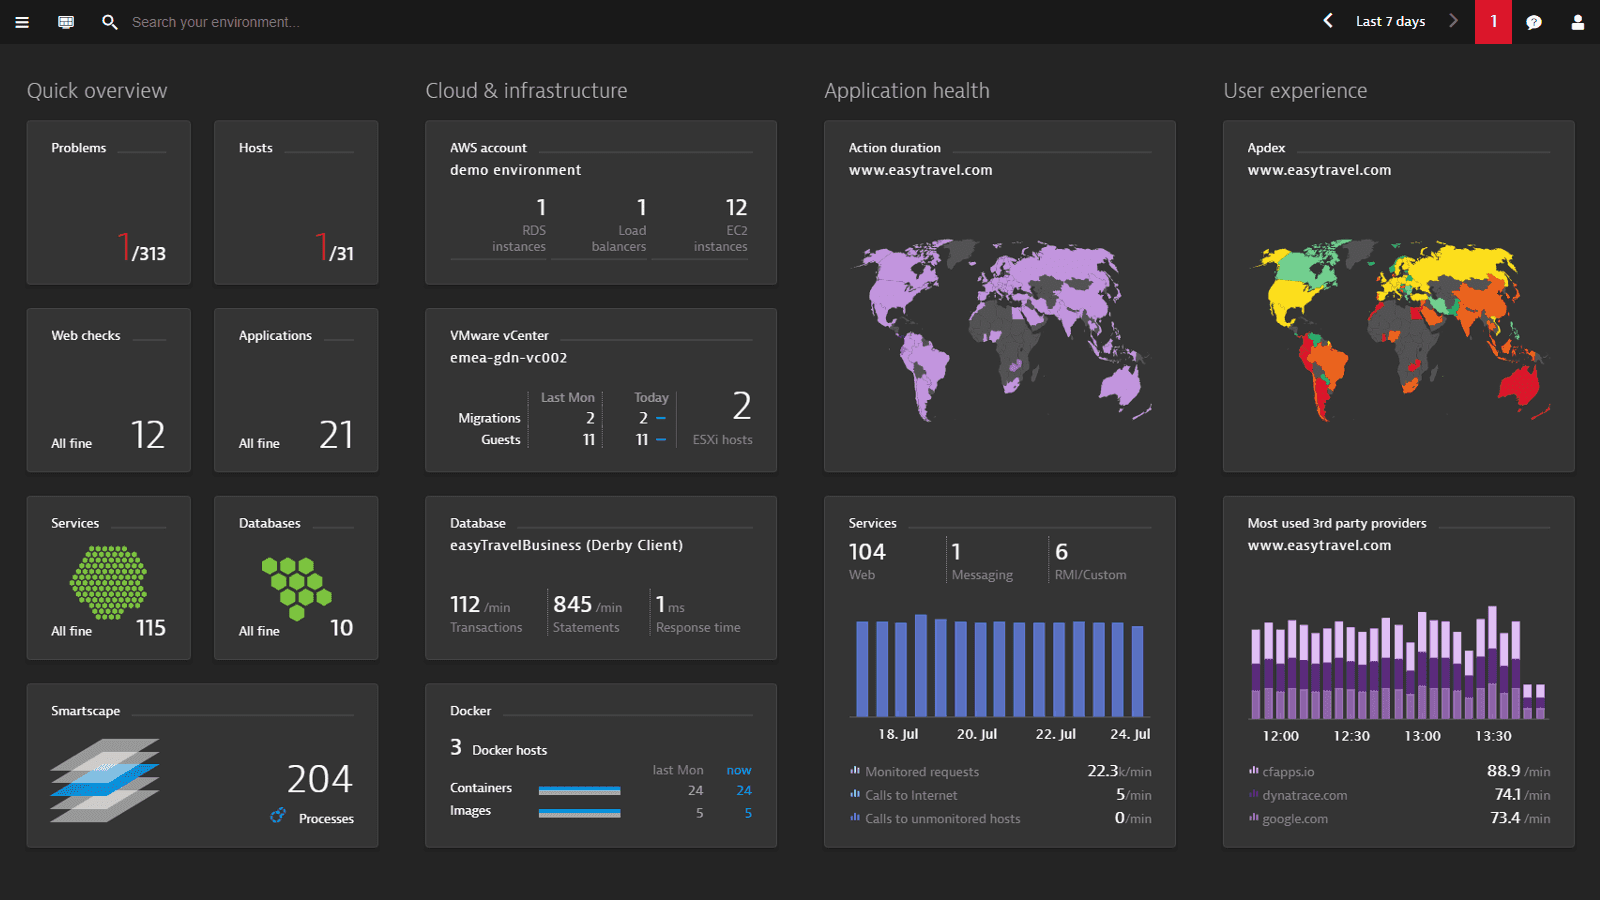
Why Choose Dynatrace: Dynatrace leads in AI-powered application monitoring with its Davis AI engine providing automated root cause analysis and intelligent problem detection. The platform excels in complex enterprise environments with automatic dependency mapping and causal analysis capabilities.
Standout Features: Davis AI engine provides automated root cause analysis and predictive analytics for proactive issue prevention. OneAgent technology enables automatic instrumentation without code changes. The platform includes advanced topology mapping and dependency analysis for complex application environments.
Integrations: Comprehensive cloud platform support with native integration for major providers. Extensive automation capabilities through APIs and integration with DevOps toolchains.
Splunk AppDynamics
Best for business transaction monitoring (part of Splunk)
- 30-day free trial
- Custom enterprise pricing
- Visit Website ›
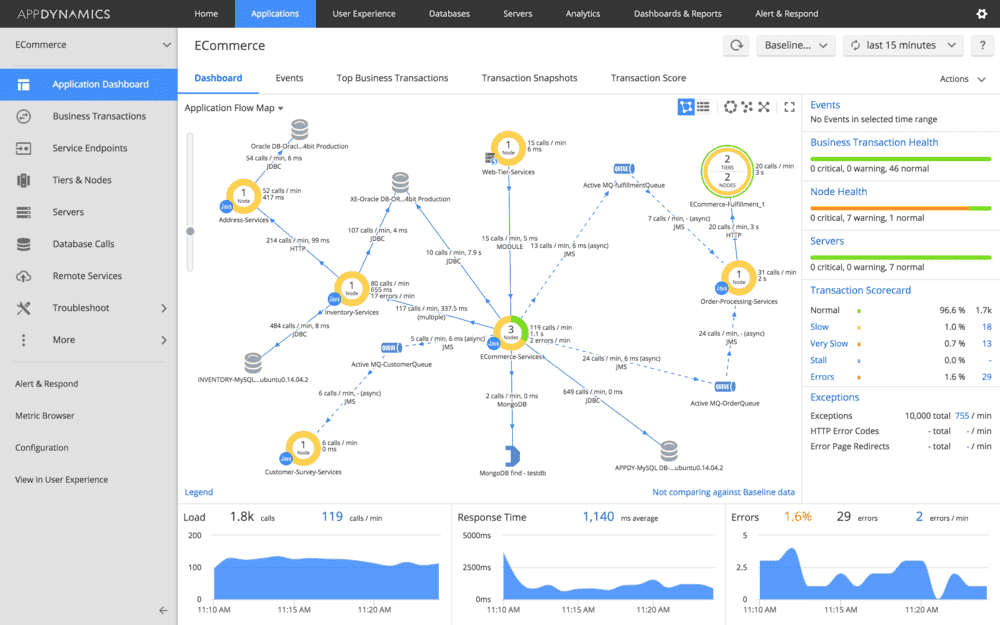
Why Choose Splunk AppDynamics: AppDynamics specializes in business transaction monitoring with strong correlation between application performance and business outcomes. Now part of Splunk's enterprise observability portfolio, it provides detailed insights into how application performance impacts business metrics and user experience.
Standout Features: Business transaction monitoring connects application performance directly to business impact and revenue metrics. Advanced flow mapping provides visual representation of application dependencies and transaction flows. The platform includes comprehensive mobile app monitoring and user experience analytics.
Integrations: Strong integration with Splunk's broader observability and security platform. Extensive support for enterprise applications and cloud platforms.
Datadog
Best for cloud-native environments
- 14-day free trial
- Starting at $15/host/month
- Visit Website ›
Why Choose Datadog: Datadog provides unified monitoring and analytics platform with strong cloud-native capabilities. The solution excels in monitoring distributed systems and microservices architectures, offering comprehensive visibility across cloud environments and container orchestration platforms.
Standout Features: Advanced analytics engine supports custom metrics and automated anomaly detection. Real-time log correlation with metrics and traces enables efficient troubleshooting. The platform includes powerful visualization capabilities and customizable dashboards.
Integrations: Extensive integration catalog supports major cloud providers, container platforms, and DevOps tools. Native support for serverless architectures and service mesh technologies.
Elastic APM
Best for open-source environments
- Free open-source (self-hosted)
- Elastic Cloud pricing based on deployment size
- Visit Website ›
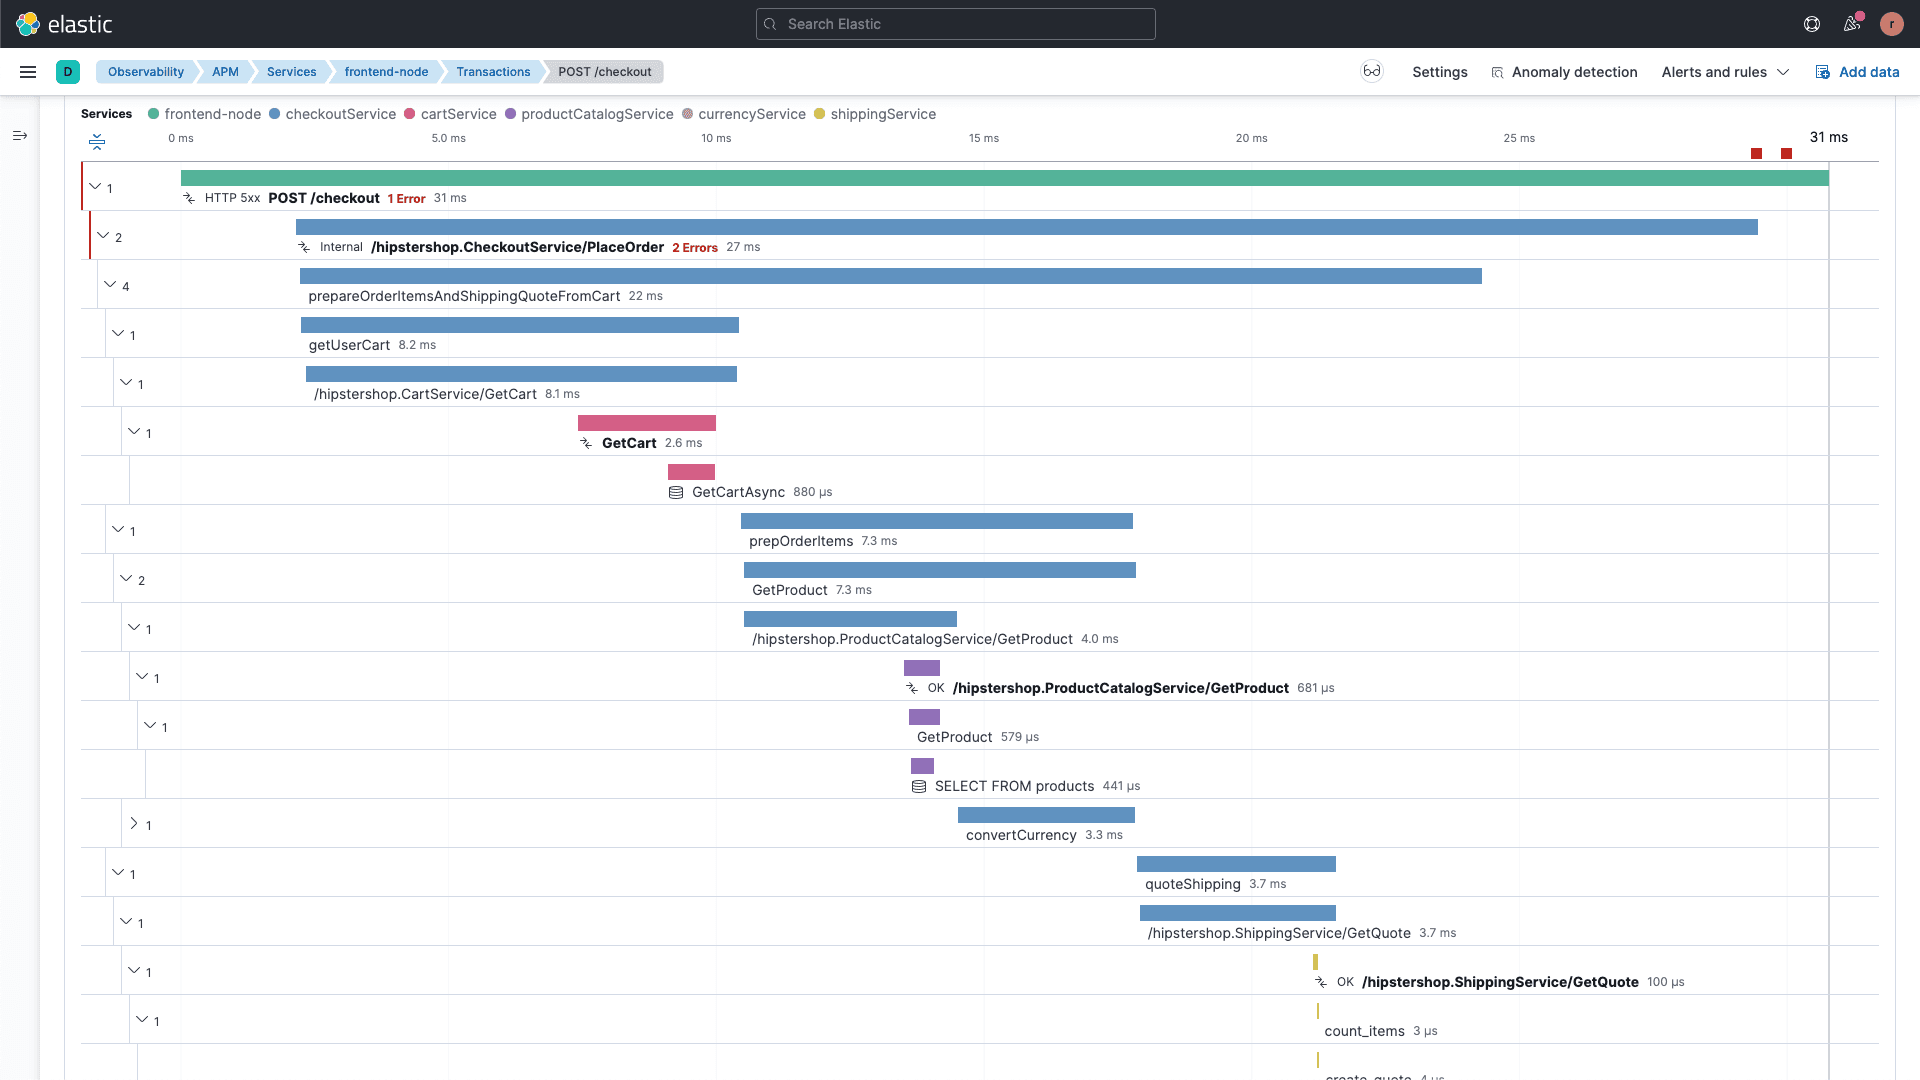
Why Choose Elastic APM: Elastic APM provides comprehensive monitoring capabilities within the Elastic Stack ecosystem. The platform offers strong integration with logging and metrics collection, making it particularly effective for organizations already utilizing Elasticsearch and Kibana.
Standout Features: Seamless integration with Elasticsearch for powerful search and analysis capabilities. Real user monitoring features provide detailed end-user experience insights. The platform includes distributed tracing and service maps for microservices visibility.
Integrations: Native integration with Elastic Stack components. Support for popular programming languages and frameworks through APM agents.
Splunk APM
Best for large-scale data analytics
- Custom pricing
- Enterprise-focused solution
- Visit Website ›
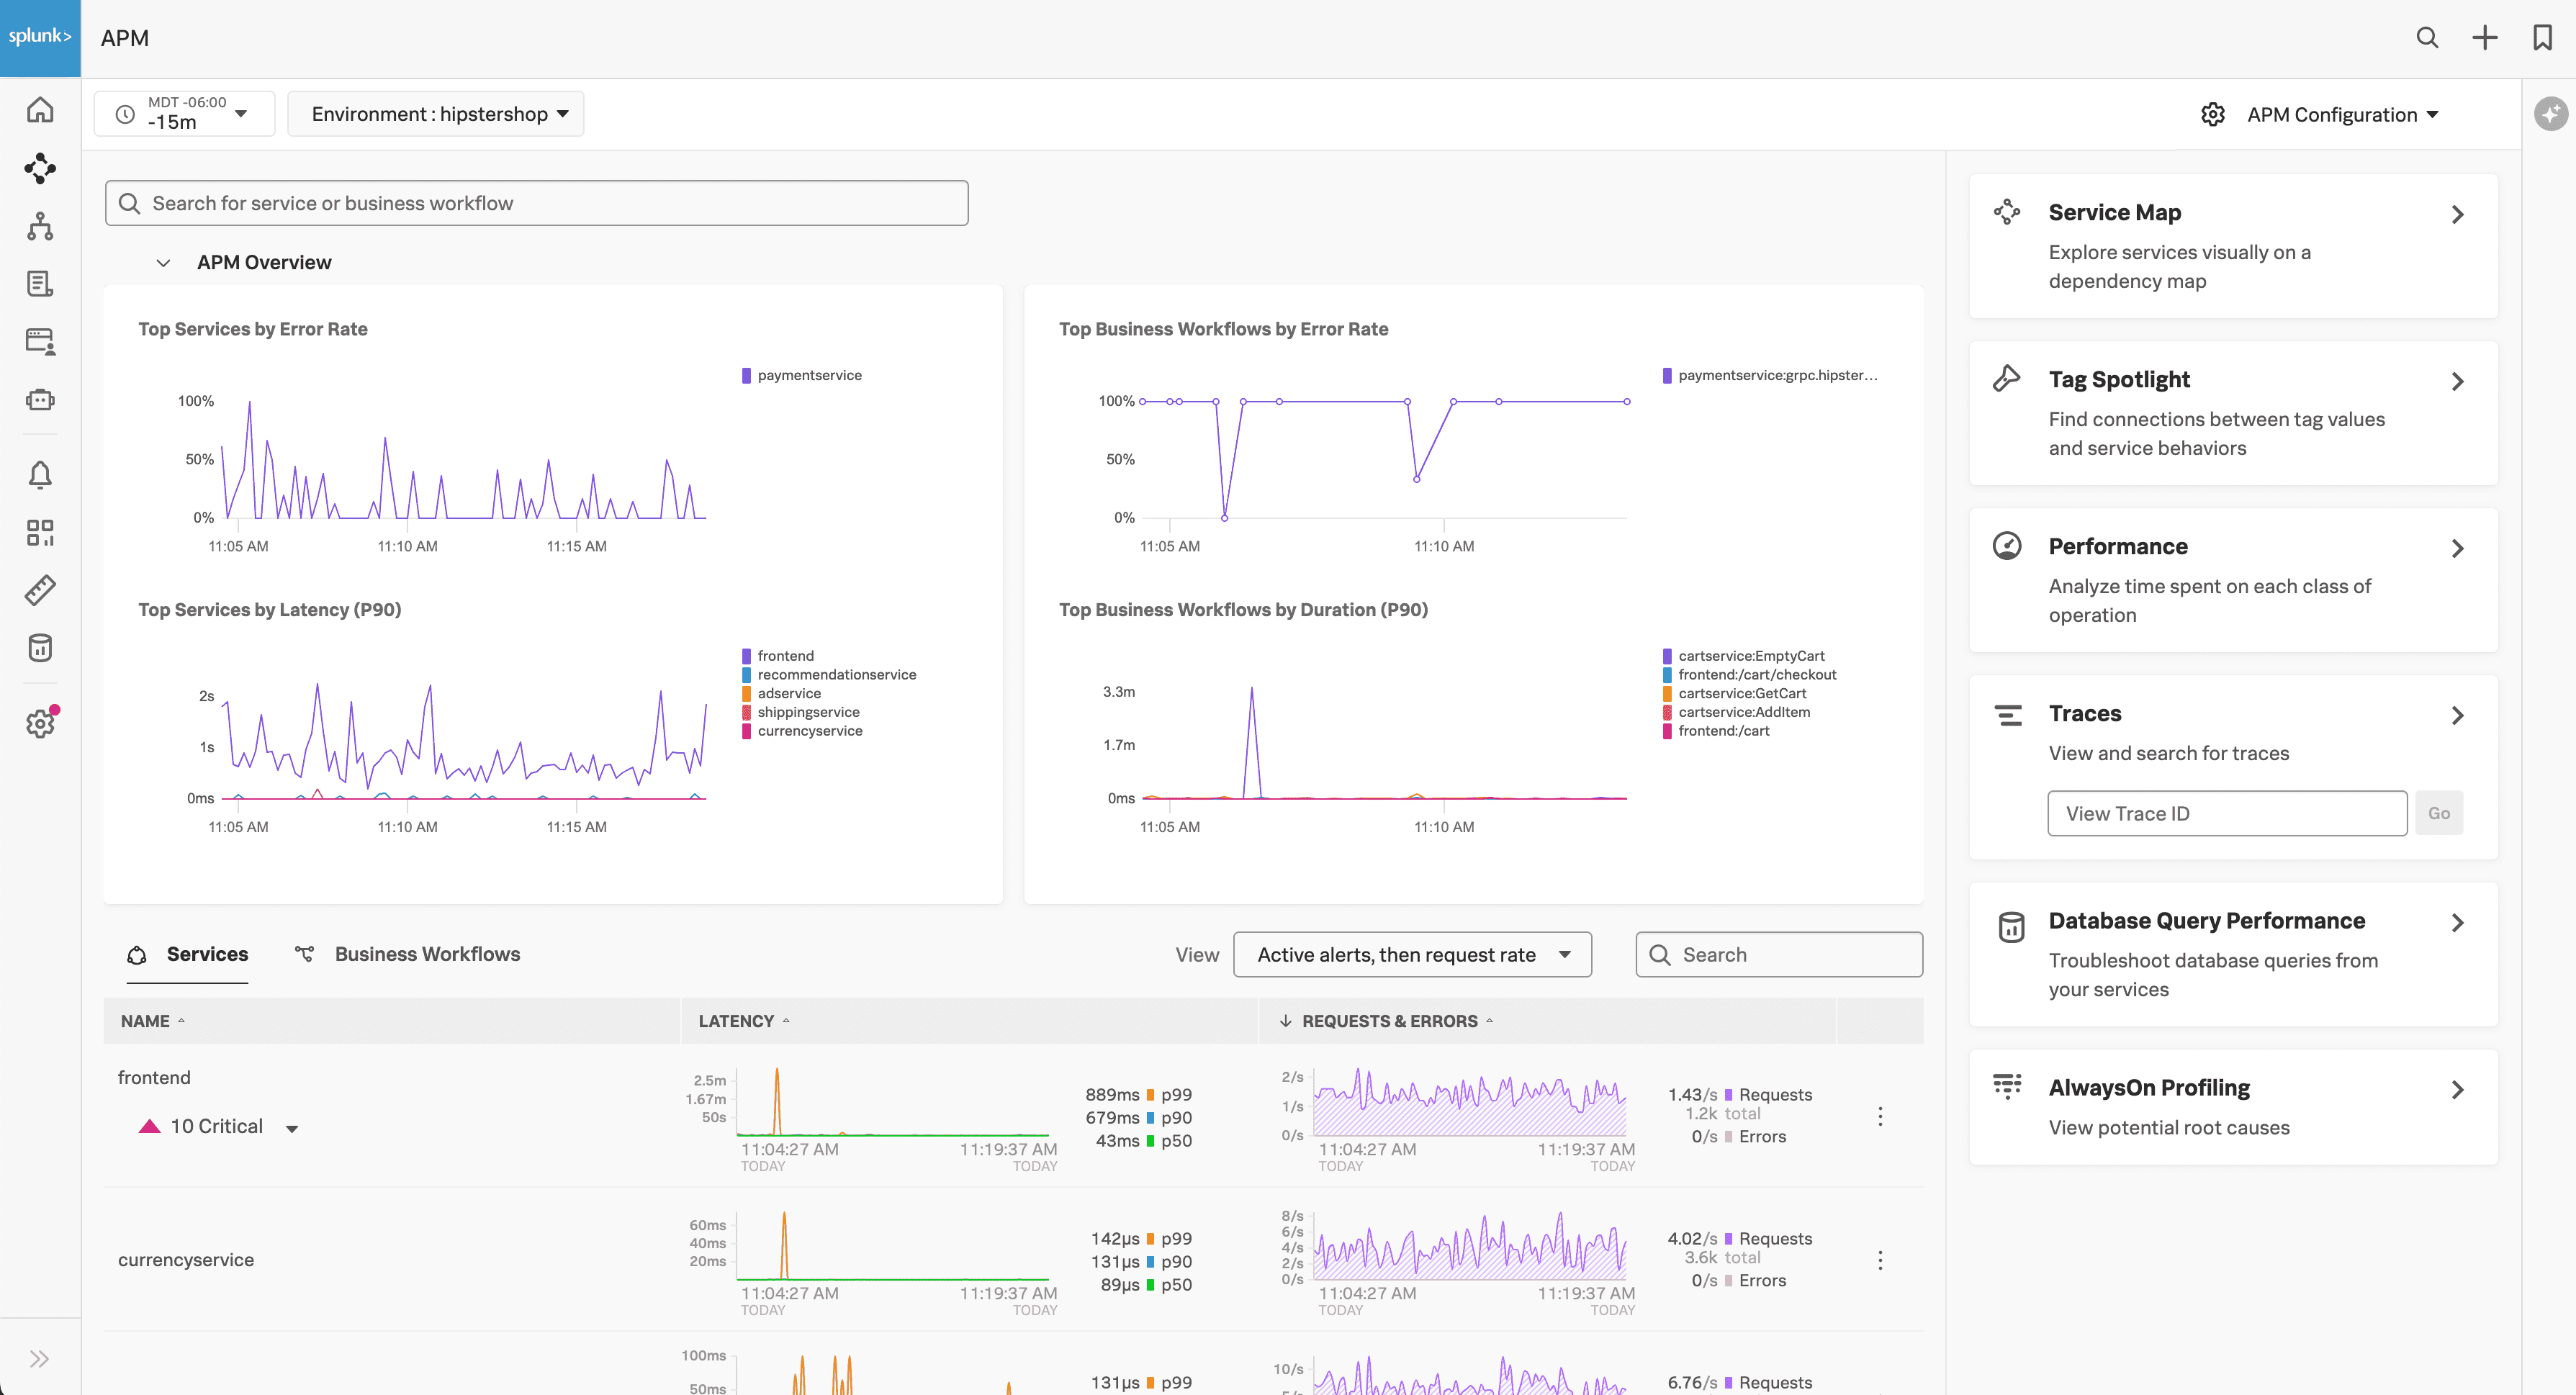
Why Choose Splunk APM: Splunk APM combines powerful data analytics capabilities with comprehensive application monitoring features. The platform's sophisticated analysis capabilities and scalable architecture make it suitable for organizations with complex data analysis requirements and large-scale deployments.
Standout Features: NoSample™ technology enables full-fidelity data collection and analysis. Advanced analytics capabilities support complex queries and custom dashboards. The platform includes AI-driven anomaly detection and automated troubleshooting features.
Integrations: Comprehensive integration with Splunk's enterprise platform ecosystem. Extensive support for custom data sources and third-party tools through APIs and plugins.
AppSignal
Best for developer-friendly monitoring
- 30-day free trial; free plan available
- Starting at $23.25/month (annual)
- Visit Website ›
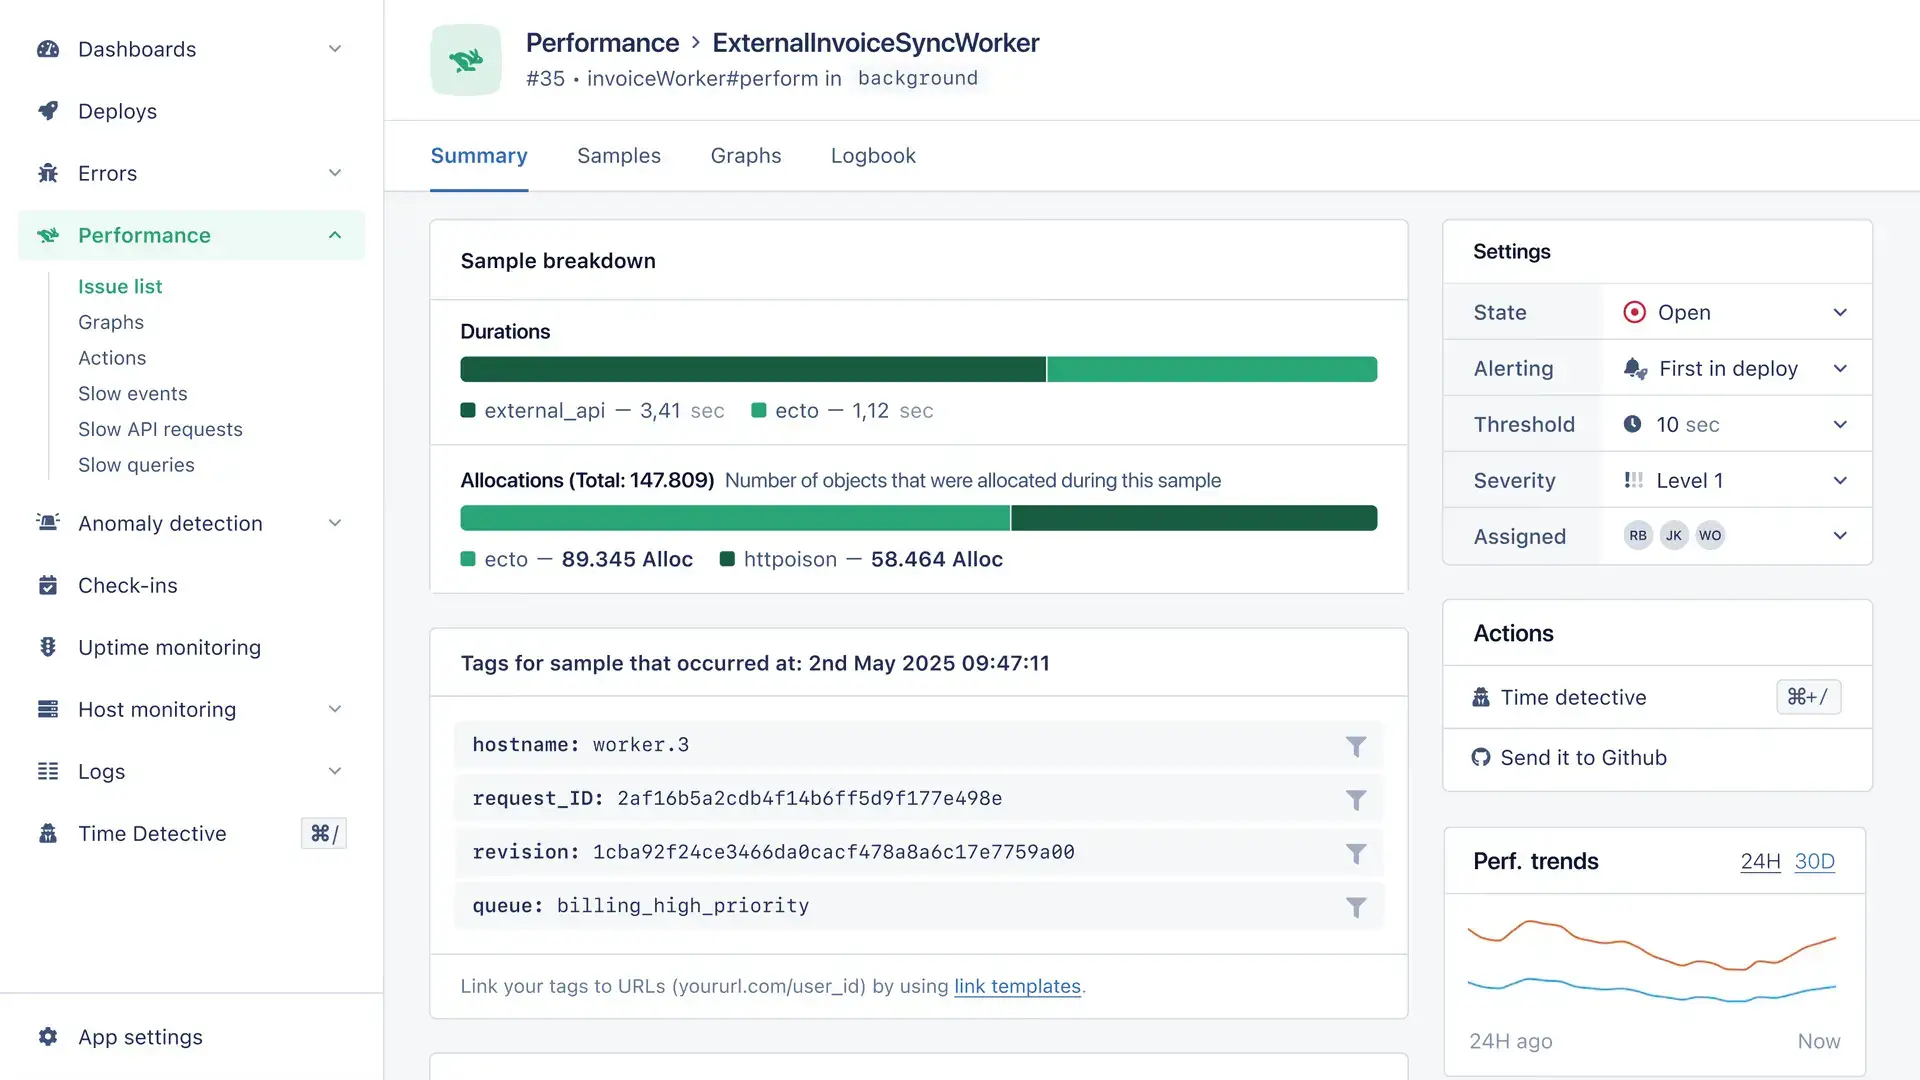
Why Choose AppSignal: AppSignal focuses on developer experience with clean, intuitive interfaces and developer-centric features. The platform emphasizes simplicity and actionable insights, making it particularly suitable for development teams seeking straightforward application monitoring.
Standout Features: Developer-focused interface with clear performance insights and actionable recommendations. Comprehensive error tracking with detailed stack traces and context information. The platform includes custom metrics and dashboards for application-specific monitoring needs.
Integrations: Strong support for Ruby, Elixir, and Node.js applications. Integration capabilities with popular development frameworks and deployment platforms.
Scout APM
Best for Ruby and Python applications
- 14-day free trial; free tier available (300K transactions/month)
- Transaction-based pricing from $19/month
- Visit Website ›
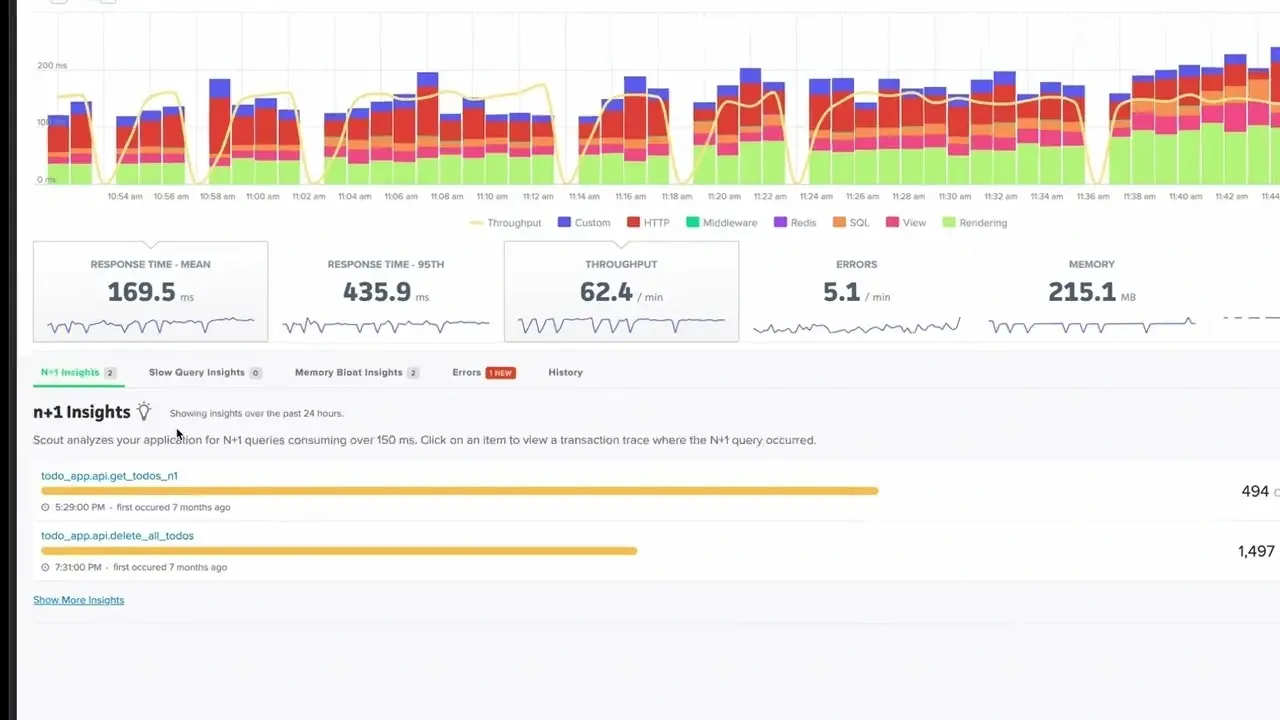
Why Choose Scout APM: Scout APM specializes in monitoring Ruby and Python applications with detailed performance insights and optimization recommendations. The platform provides developer-friendly interfaces and actionable performance data for application optimization.
Standout Features: Detailed code-level performance analysis with specific optimization recommendations. N+1 query detection and database performance optimization suggestions. The platform includes memory profiling and performance trend analysis capabilities.
Integrations: Specialized support for Ruby and Python frameworks including Rails, Django, and Flask. Integration with common development and deployment tools.
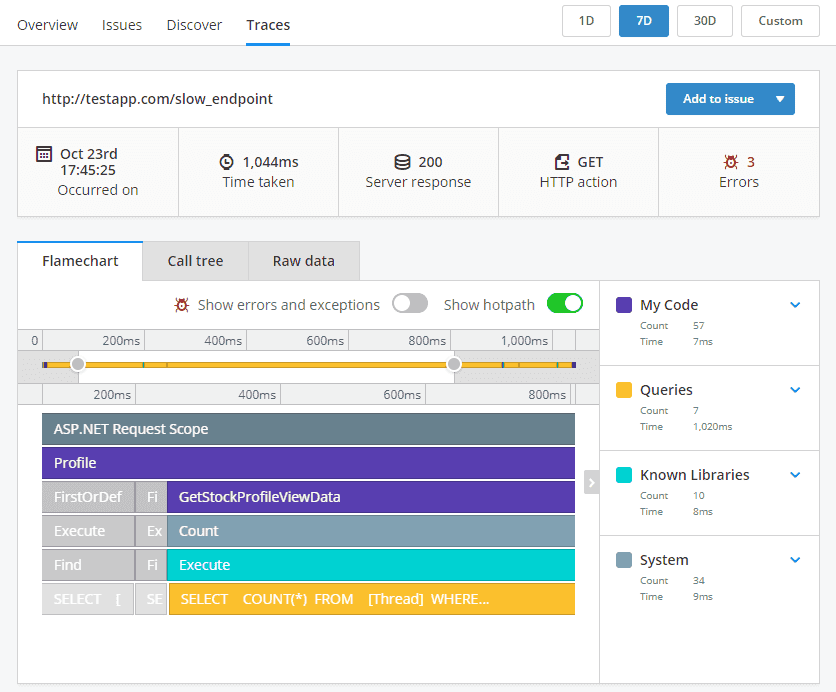
SolarWinds APM
Best for traditional IT environments
- 30-day free trial
- From $7/node/month (annual)
- Visit Website ›
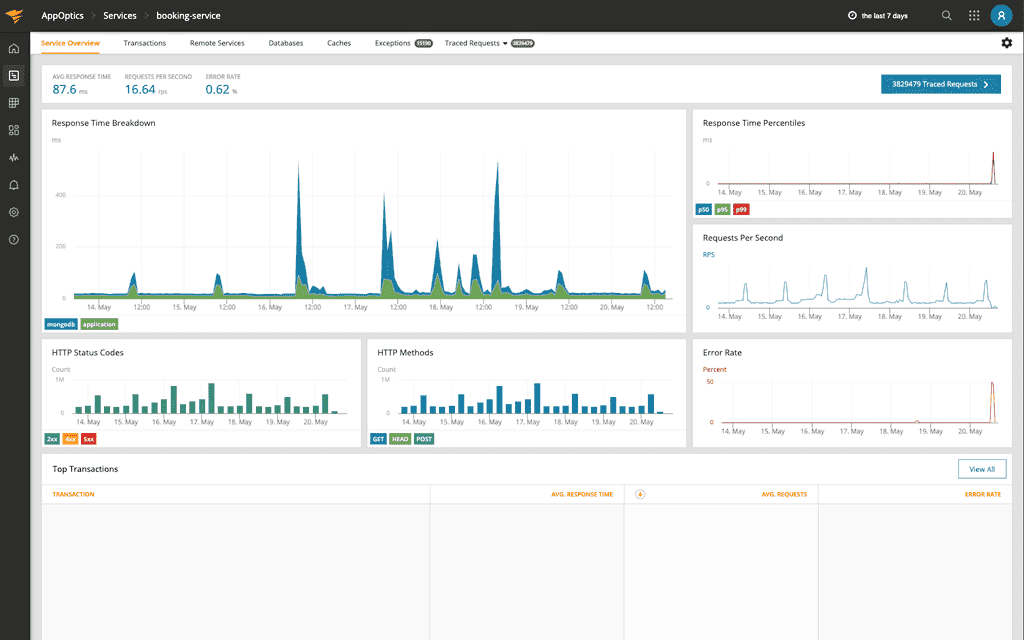
Why Choose SolarWinds APM: SolarWinds APM delivers comprehensive monitoring capabilities with focus on traditional IT infrastructure. The platform provides strong integration with network monitoring tools, making it particularly suitable for organizations with significant on-premise infrastructure.
Standout Features: Detailed application stack visibility with code-level diagnostics. Network performance correlation with application metrics. The platform includes automated dependency mapping and performance baseline analysis.
Integrations: Strong integration with SolarWinds network management suite. Support for major application frameworks and infrastructure components.
Raygun
Best for error tracking and real user monitoring
- 14-day free trial
- Starting at $40/month (Basic, 100K events)
- Visit Website ›
Why Choose Raygun: Raygun specializes in error tracking and real user monitoring with comprehensive crash reporting and performance insights. The platform provides detailed error analysis and user experience monitoring for web and mobile applications.
Standout Features: Advanced error tracking with detailed crash reports and deployment tracking. Real user monitoring provides insights into actual user experiences and performance metrics. The platform includes proactive alerting and team collaboration features.
Integrations: Comprehensive support for web and mobile application frameworks. Integration capabilities with development and deployment workflows.
ManageEngine
Best for cost-effective monitoring
- 30-day free trial
- Starting at $945/year
- Visit Website ›
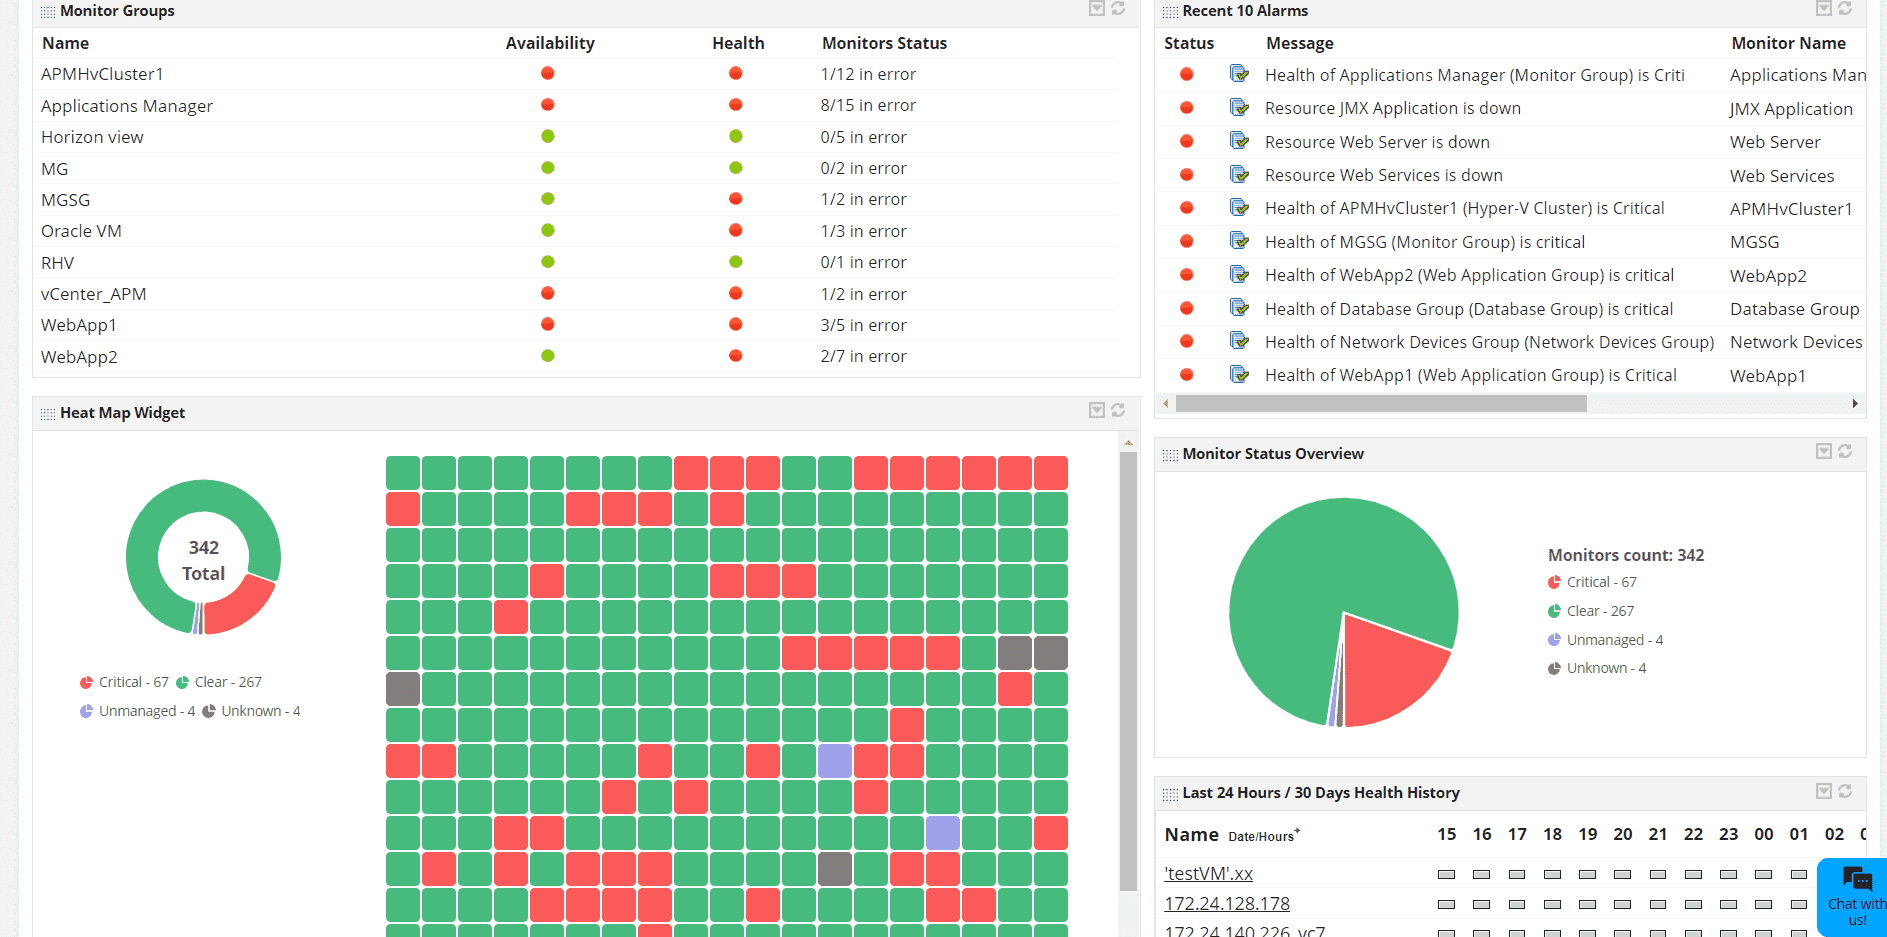
Why Choose ManageEngine: ManageEngine Applications Manager provides comprehensive application monitoring capabilities at competitive pricing points. The platform offers strong support for traditional applications and databases, making it suitable for organizations seeking cost-effective monitoring solutions.
Standout Features: Extensive support for legacy applications and databases. Root cause analysis capabilities with automated dependency mapping. The platform includes synthetic transaction monitoring and SLA management features.
Integrations: Integration support for common enterprise applications and databases. API-based integration capabilities for custom monitoring requirements.
highlight.io
Best for full-stack web monitoring
- Open-source version available
- Cloud hosting options
- Visit Website ›
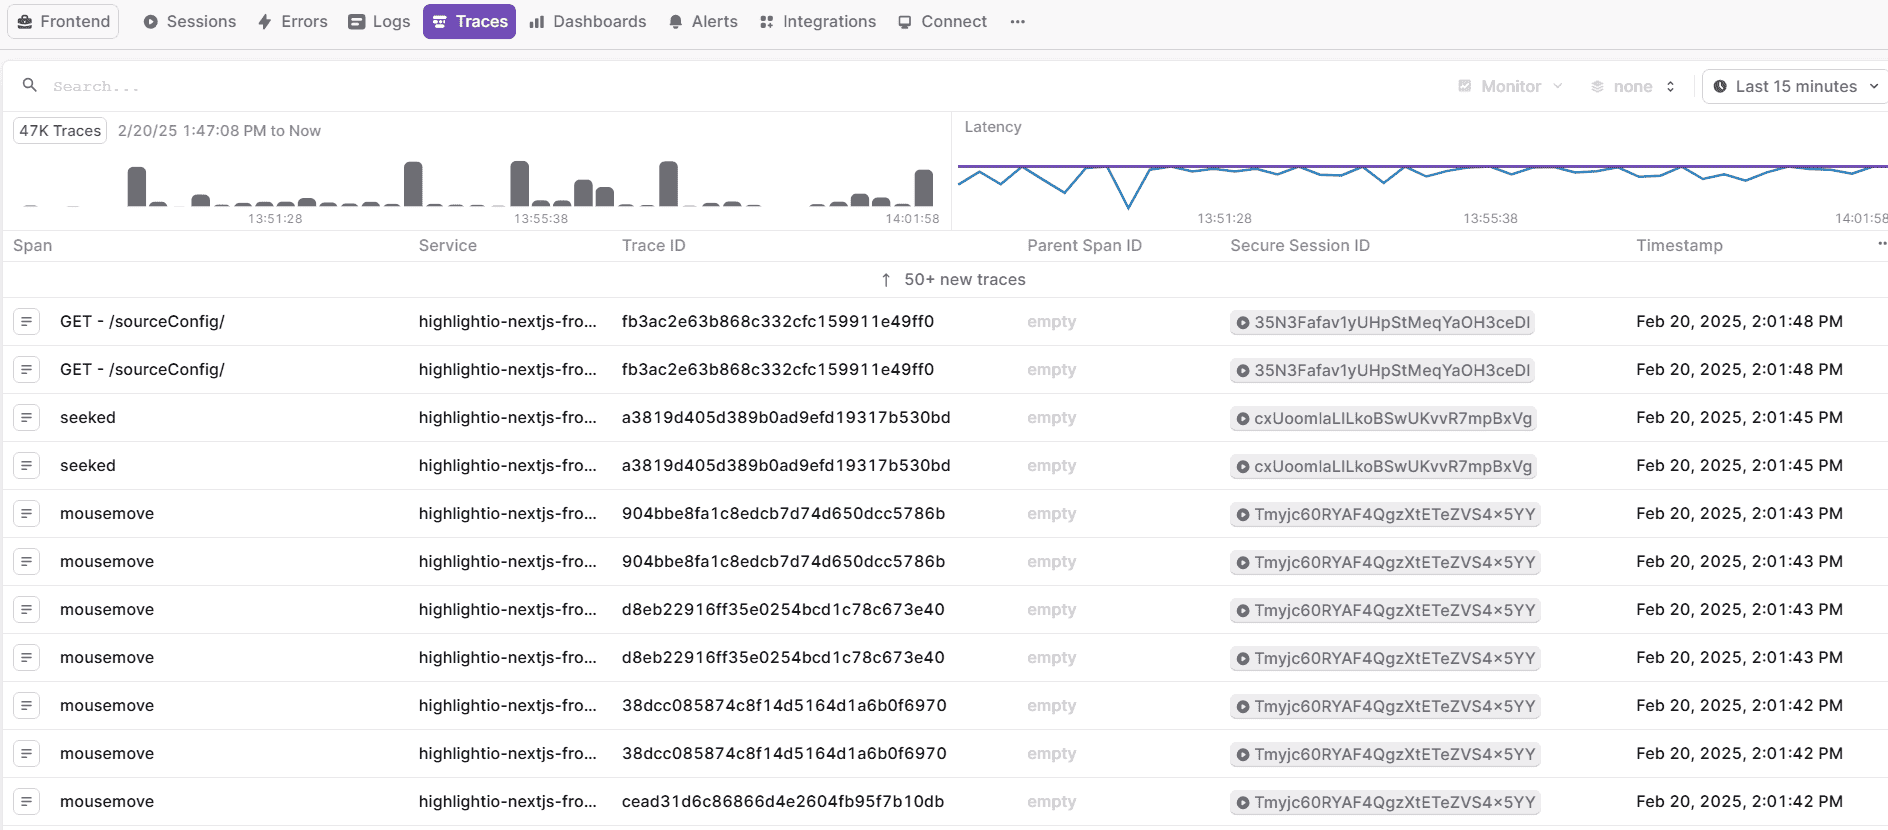
Why Choose highlight.io: highlight.io combines comprehensive error tracking, session replay, and distributed tracing capabilities in a single platform. The solution's integrated approach to web application monitoring makes it particularly suitable for organizations requiring detailed user experience insights alongside technical performance metrics.
Standout Features: Integrated session replay with technical context for issue reproduction. ClickHouse-based backend enabling petabyte-scale data analysis. The platform includes comprehensive error tracking and categorization capabilities.
Integrations: Support for major web frameworks and technologies. Integration capabilities with existing development workflows. Extensive API for custom data ingestion and analysis.
Scouter
Best for Java applications
- Free, open-source
- Community-driven development
- Visit Website ›
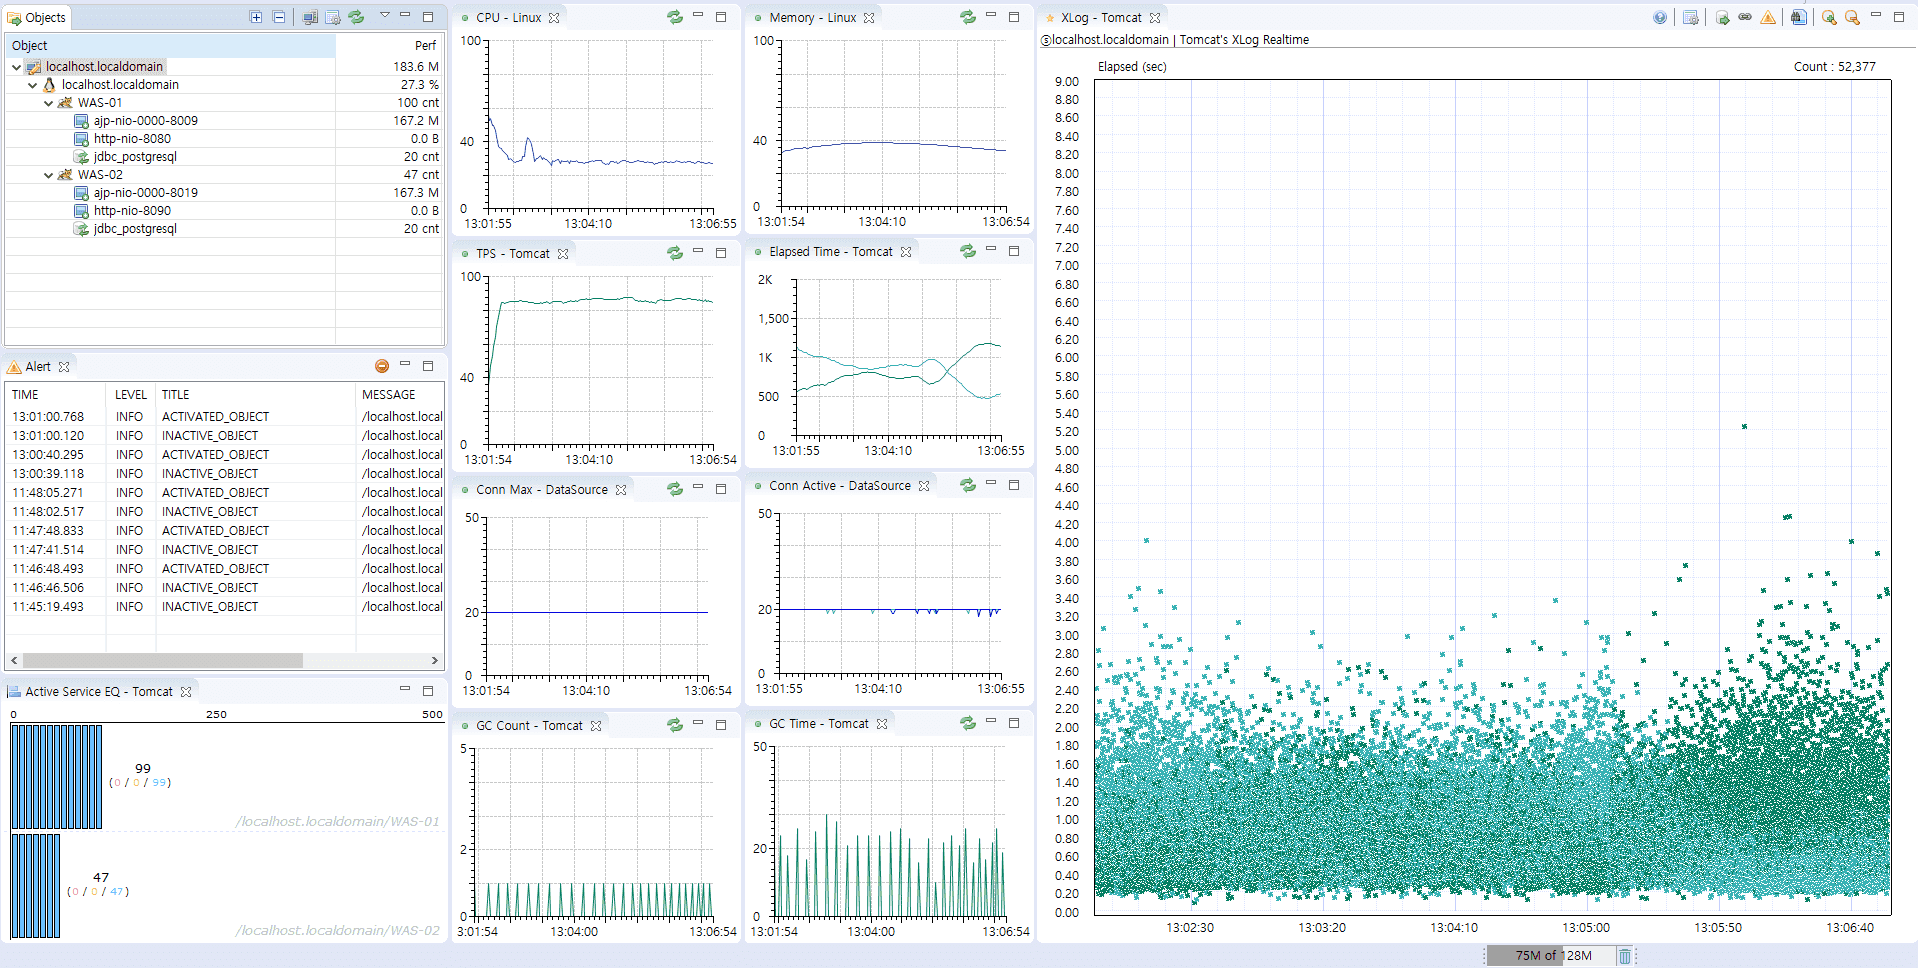
Why Choose Scouter: Scouter provides specialized monitoring capabilities for Java-based applications with minimal overhead. The platform's focus on JVM metrics and SQL performance makes it particularly effective for organizations running Java-centric application stacks.
Standout Features: Detailed JVM metrics monitoring and analysis capabilities. Comprehensive SQL query performance tracking and optimization suggestions. The platform includes service dependency mapping with minimal configuration requirements.
Integrations: Native support for common Java frameworks and libraries. Integration capabilities with standard monitoring tools. Support for custom metric collection and analysis.
Instana
Best for automatic application discovery and tracing
- 14-day free trial
- Custom enterprise pricing
- Visit Website ›
Why Choose Instana: Instana, now part of IBM, delivers automatic application discovery and continuous dependency mapping, making it especially effective for dynamic microservices environments. The platform emphasizes zero-configuration instrumentation and provides real-time observability for cloud-native architectures.
Standout Features: Automatic application discovery and dependency mapping with no manual configuration required. Continuous profiling provides insights into code-level performance in production. The platform includes AI-powered root cause analysis and anomaly detection for faster troubleshooting.
Integrations: Strong support for Kubernetes, Docker, and cloud-native platforms. Extensive integrations with CI/CD pipelines, DevOps toolchains, and major programming languages and frameworks.
Sentry
Best for error tracking with APM integration
- Free plan available
- Starting at $26/month
- Visit Website ›
Why Choose Sentry: Sentry started as an error tracking platform and evolved into a full-stack APM tool with performance monitoring, distributed tracing, and session replay. Its developer-first design makes it particularly popular for web and mobile applications — errors include full stack traces, breadcrumbs, release tracking, and user context out of the box.
Standout Features: Error monitoring with contextual data tied directly to performance traces. Transaction tracing connects slow requests to specific errors. Session replay enables frontend debugging without needing to reproduce issues manually. Profiling provides code-level bottleneck detection in production.
Integrations: 100+ SDKs covering all major languages and frameworks. Deep integration with GitHub, GitLab, Jira, and Slack for developer workflow automation.
How to Choose the Right APM Software
Selecting the right application performance monitoring tool requires careful consideration of several factors:
- Application Architecture: Consider whether you're monitoring monolithic applications, microservices, or hybrid environments
- Programming Languages: Ensure the APM tool supports your stack. For .NET APM see OpenTelemetry .NET instrumentation; for Java, Python, and Node.js most tools provide native agents
- Deployment Model: Evaluate on-premise, cloud, or hybrid deployment options
- Scale Requirements: Consider current and future data volume and user scale
- Budget Constraints: Balance feature requirements with cost considerations
- Team Expertise: Consider the learning curve and required technical expertise
Conclusion
The application performance monitoring tools market in 2026 offers diverse solutions for different needs, budgets, and technical requirements. Whether you need comprehensive enterprise APM platforms like Dynatrace and New Relic, cost-effective solutions like Uptrace and Elastic APM, or specialized tools for specific use cases, the key is choosing an APM solution that aligns with your application architecture, team capabilities, and business objectives.
When evaluating APM software, consider not just the current requirements but also future growth and evolving technology needs. The right application monitoring tool will grow with your organization, providing continuous value as your applications and infrastructure evolve.
FAQ
- What is the difference between APM and application monitoring? APM (Application Performance Monitoring) and application monitoring are often used interchangeably, but APM typically refers to more comprehensive solutions that include end-user experience monitoring, business transaction tracking, and advanced analytics, while basic application monitoring might focus on simpler metrics like uptime and response times.
- What is the best open source APM tool? Uptrace and Elastic APM are the leading open source APM options. Uptrace is OpenTelemetry-native with a ClickHouse backend — self-hosted and free under AGPL. Elastic APM integrates tightly with the ELK stack and is free to self-host. Check open source APM.
- How do application monitoring tools work? Application monitoring tools work by instrumenting your applications with agents or libraries that collect performance data, metrics, and traces. This data is then aggregated, analyzed, and presented through dashboards and alerts to provide insights into application performance and user experience.
- What features should I look for in APM software? Essential APM features include real-time monitoring, distributed tracing, error tracking, user experience monitoring, custom dashboards, intelligent alerting, and integration capabilities with your existing tools and workflows.
- How does APM differ from infrastructure monitoring? APM focuses on application-level metrics like transaction response times, error rates, and user experience, while infrastructure monitoring tracks system-level metrics like CPU usage, memory consumption, and network performance. Both are important for comprehensive system visibility.
- How do APM tools compare to each other? Key differences are pricing model (per-host vs per-user vs usage-based), deployment (cloud vs self-hosted), and OpenTelemetry support. For a detailed side-by-side, see Top Observability Tools 2026.
- What is the typical cost of APM software? APM software costs vary widely depending on features, scale, and deployment model. Open-source solutions are free but require infrastructure and maintenance costs, while commercial solutions typically range from $23–500+ per month depending on hosts, users, or data volume.
- How do I measure ROI from APM tools? Measure APM ROI by calculating time saved on troubleshooting, reduced downtime costs, improved user satisfaction, faster development cycles, and cost optimization from performance improvements. Many organizations see ROI within 3-6 months of implementation.
- How do I set up APM for .NET applications? Use OpenTelemetry .NET instrumentation with any OTel-compatible backend. It supports auto-instrumentation for ASP.NET Core, HttpClient, SQL, and more without code changes. See the OpenTelemetry .NET setup guide for step-by-step instructions.
- How do I choose between cloud-based and on-premise APM solutions? Choose cloud-based APM for easier setup, automatic scaling, and reduced maintenance overhead. Choose on-premise solutions if you have strict data privacy requirements, regulatory constraints, or significant existing infrastructure investments.
You may also be interested in: