Top 5 Application Insights Alternatives in 2025: Open-Source & Cloud
Application Insights pricing hit $2.30-2.76 per GB in 2025, pushing teams to reconsider their Azure Monitor commitment. If unpredictable costs, Azure vendor lock-in, or OpenTelemetry migration complexity brought you here, you're not alone.
What is Application Insights?
Application Insights transformed into an OpenTelemetry feature of Azure Monitor in 2025, offering APM for live web applications. Microsoft pushed three major changes that disrupted existing deployments:
OpenTelemetry Migration: Microsoft shifted Application Insights to the Azure Monitor OpenTelemetry Distro, phasing out the classic SDK. While this aligns with industry standards, the transition created friction for existing users who faced incomplete documentation and feature gaps.
TLS 1.0/1.1 Retirement: Azure retired legacy TLS protocols for Application Insights on May 1, 2025, forcing infrastructure updates across customer deployments.
Workspace-Based Mandatory: All Application Insights resources now require workspace-based architecture, storing telemetry in Log Analytics with separate billing.
AI Code Optimizations: Microsoft launched Code Optimizations in September 2025, using AI to analyze .NET profiler traces for performance bottlenecks. Limited to .NET applications only.
Pricing Reality: Application Insights charges $2.30-2.76 per GB after a minimal 5 GB free tier per billing account. One engineering team reported $4,000 in two weeks from chatty Azure SDK logging—the 100 GB daily cap prevented unlimited damage but still cost $300/day.
💡 Note: All pricing information in this article is approximate and may vary depending on region, subscription type, contractual terms, and currency fluctuations.
Why Companies Leave App Insights
Teams leave Application Insights for three reasons: cost unpredictability, Azure ecosystem lock-in, and the OpenTelemetry paradox.
Rising Costs
Application Insights pricing ($2.30-2.76/GB) exceeds competitors by 5-20x:
- Uptrace: $0 (open source) or $0.10-0.15/GB hosted
- New Relic: $0.30-0.40/GB
- Elastic APM: ~$0.10/GB
- Datadog: $0.10/GB (logs)
A 500 GB/month deployment costs $1,150-1,380 on Application Insights versus $50-75 on Uptrace Cloud—a 95% cost reduction.
Azure Vendor Lock-In
Application Insights couples tightly with Azure services. Multi-cloud teams (AWS + Azure, GCP + Azure) face split observability stacks, managing separate tools for each cloud provider.
Migrating out requires replacing Azure-specific SDKs, rewriting connection strings, and abandoning native integrations with App Service, Functions, and Container Apps.
The OpenTelemetry Paradox
Microsoft marketed Application Insights as OpenTelemetry-compatible with the Azure Monitor OpenTelemetry Distro. However:
- Azure Monitor Distro hasn't reached feature parity with classic SDKs
- Microsoft admits they "still have a way to go" before OpenTelemetry matches SDK capabilities
- Customers report incomplete documentation and migration friction
If OpenTelemetry's promise is vendor neutrality, why use a vendor-specific OpenTelemetry distribution? Teams seeking true portability choose native OpenTelemetry collectors with vendor-agnostic backends.
Top 5 Application Insights Alternatives
Uptrace: OpenTelemetry-Native APM
Best for: Teams using OpenTelemetry and looking for a cost-efficient, vendor-neutral APM platform
Uptrace is an OpenTelemetry-native APM platform that ingests OTLP data directly without requiring proprietary agents or translation layers. Unlike Application Insights, which added OpenTelemetry support later, Uptrace was built around OpenTelemetry from the start, making it fully compatible with standard protocols, semantic conventions, and resource attributes.
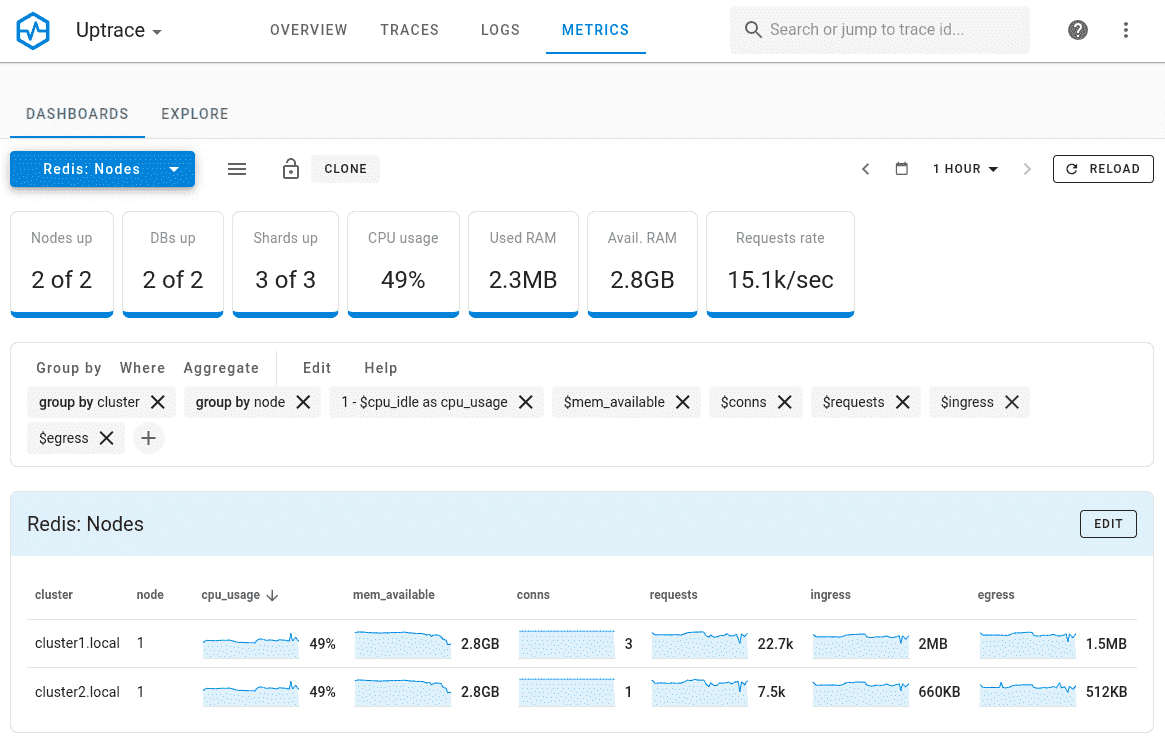
Why Uptrace:
- OpenTelemetry-native architecture: Natively ingests OTLP data and supports OpenTelemetry conventions without extra layers.
- ClickHouse storage engine: Columnar storage with high compression enables fast queries across billions of spans.
- Unified observability: Combines distributed tracing, Prometheus metrics, and log correlation in one interface.
- Open source foundation: Fully transparent core, self-hostable on Kubernetes, Docker, or bare metal.
- Cost efficiency: $0.10–0.15/GB vs. $2.30–2.76/GB for Application Insights, with no per-user or compute-based charges.
Key Features:
- Distributed tracing: Visualize request flows with flame graphs, span analytics, and error tracking.
- Metrics & alerting: Supports Prometheus metrics with PromQL queries and alert rules.
- Log correlation: Links OpenTelemetry logs to traces to provide complete debugging context.
- Service maps: Automatically generated dependency graphs for better visibility.
- High cardinality support: Query by any attribute (e.g., user ID, region) without sampling.
OpenTelemetry Support:
Native OTLP ingestion (gRPC and HTTP). Works seamlessly with OpenTelemetry SDKs for Java, Go, Python, Node.js, .NET, Ruby, PHP, and over 300 integrations.
Pricing:
- Open source: Free forever with unlimited scale (AGPLv3 license)
- Uptrace Cloud: $0.10–0.15 per GB with 14-day retention
- Transparent pricing: No per-user fees, no compute charges, no data egress costs
Migration from Application Insights:
Switch Azure Monitor exporters to OTLP exporters pointing to Uptrace. Since the instrumentation uses standard OpenTelemetry, application code changes are not required.
Pros:
- ✅ Native OpenTelemetry support without vendor lock-in
- ✅ Flexible deployment options (self-hosted or SaaS)
- ✅ Cost-efficient storage with ClickHouse
- ✅ Open-source transparency
Cons:
- ❌ Smaller integration ecosystem compared to Azure Monitor
- ❌ Self-hosted setup requires DevOps knowledge
- ❌ External tools needed for PagerDuty/Slack alerting
Best For:
- Teams adopting OpenTelemetry for observability
- Multi-cloud environments (AWS, GCP, Azure)
- Cost-conscious organizations migrating away from Application Insights
Get Started with Uptrace in 5 Minutes
Elastic APM: Full Stack Observability
Best for: Teams already using Elasticsearch or needing powerful log correlation
Elastic APM integrates OpenTelemetry support into the battle-tested ELK stack (Elasticsearch, Logstash, Kibana). Organizations running Elasticsearch for log management gain APM capabilities without adding separate tools.
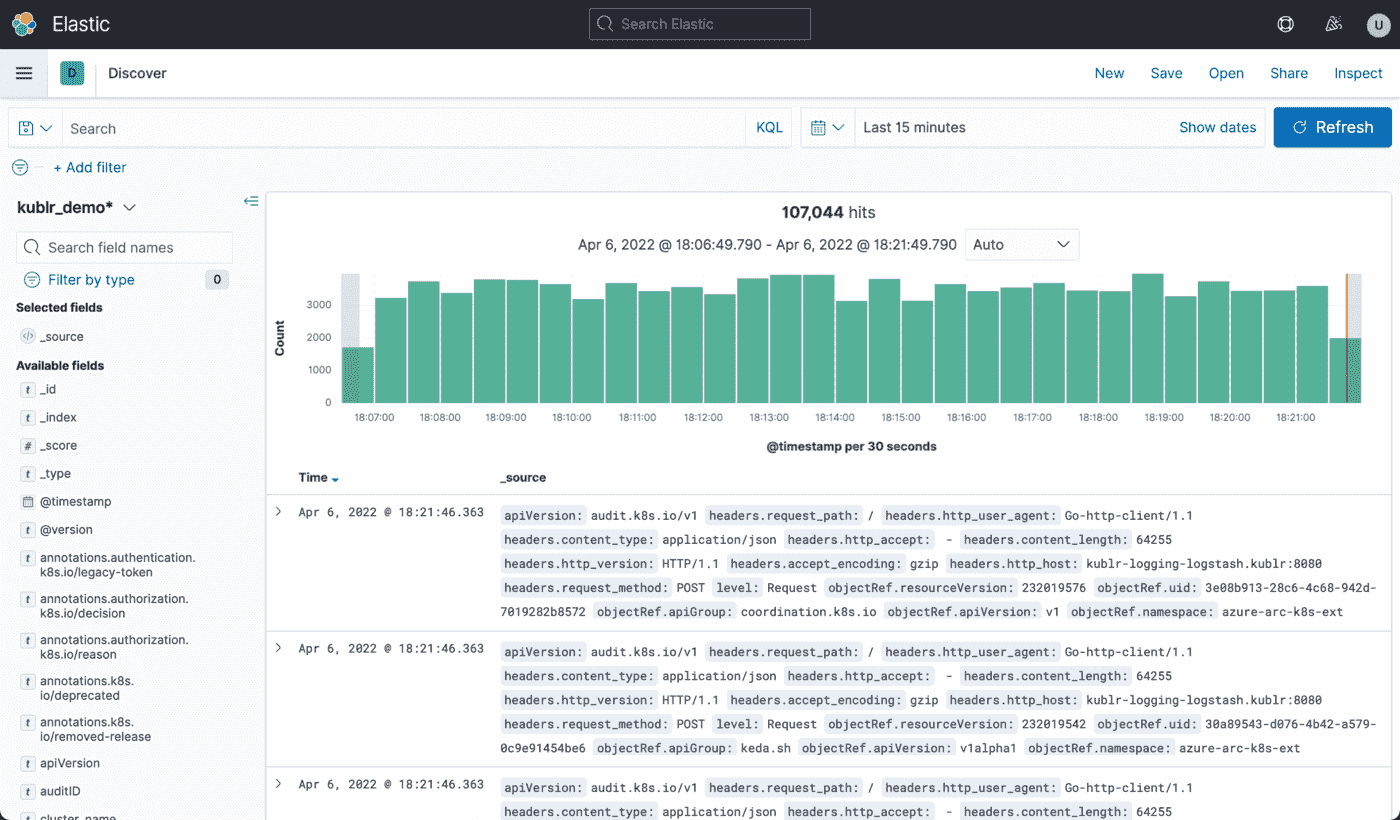
Why Elastic APM:
- ELK Stack Synergy: Unified search across logs, metrics, traces, and events in one Elasticsearch cluster
- Machine Learning Anomaly Detection: Automatically identify performance degradations and unusual patterns
- OpenTelemetry Compatible: Native OTLP ingestion alongside Elastic APM agents
- Open Source Foundation: Self-host under Elastic License 2.0 for full control
Key Features:
- Distributed Tracing: End-to-end request visibility with service maps and error tracking
- Real User Monitoring (RUM): Track frontend performance and user sessions
- Kubernetes Observability: Deep container and orchestration visibility with APM data
- Integrated Logs: Correlate application traces with infrastructure logs in Kibana
OpenTelemetry Support:
Elastic APM accepts OpenTelemetry data through OTLP ingestion, though Elastic APM agents provide richer metadata for their stack.
Pricing:
- Self-Managed: Free under Elastic License 2.0
- Elastic Cloud Standard: Starting at $95/month with ~$0.10/GB effective cost
- Enterprise Tier: $125-175/month base plus usage-based costs for advanced security features
Migration from Application Insights:
Deploy OpenTelemetry Collector with OTLP exporter pointing to Elastic APM endpoint. Existing OpenTelemetry instrumentation requires zero code changes.
Pros:
- ✅ Powerful log correlation across entire stack
- ✅ Open source option eliminates vendor lock-in
- ✅ Mature Kubernetes monitoring capabilities
- ✅ Large ecosystem with 500+ integrations
Cons:
- ❌ Elasticsearch cluster management complexity
- ❌ Resource-intensive for high-volume workloads (16GB+ RAM per node)
- ❌ Machine learning features locked behind Gold tier
Best For:
- Organizations already invested in Elasticsearch
- Teams needing tight log-trace correlation
- Enterprises requiring HIPAA/GDPR compliance with self-hosted deployment
New Relic: Commercial APM with Generous Free Tier
Best for: Teams wanting commercial support with predictable per-GB pricing
New Relic charges $0.40/GB for standard data ingest ($0.60/GB for Data Plus with extended retention) after a 100 GB free tier. User-based pricing adds full platform users at $349/year on Pro tier.
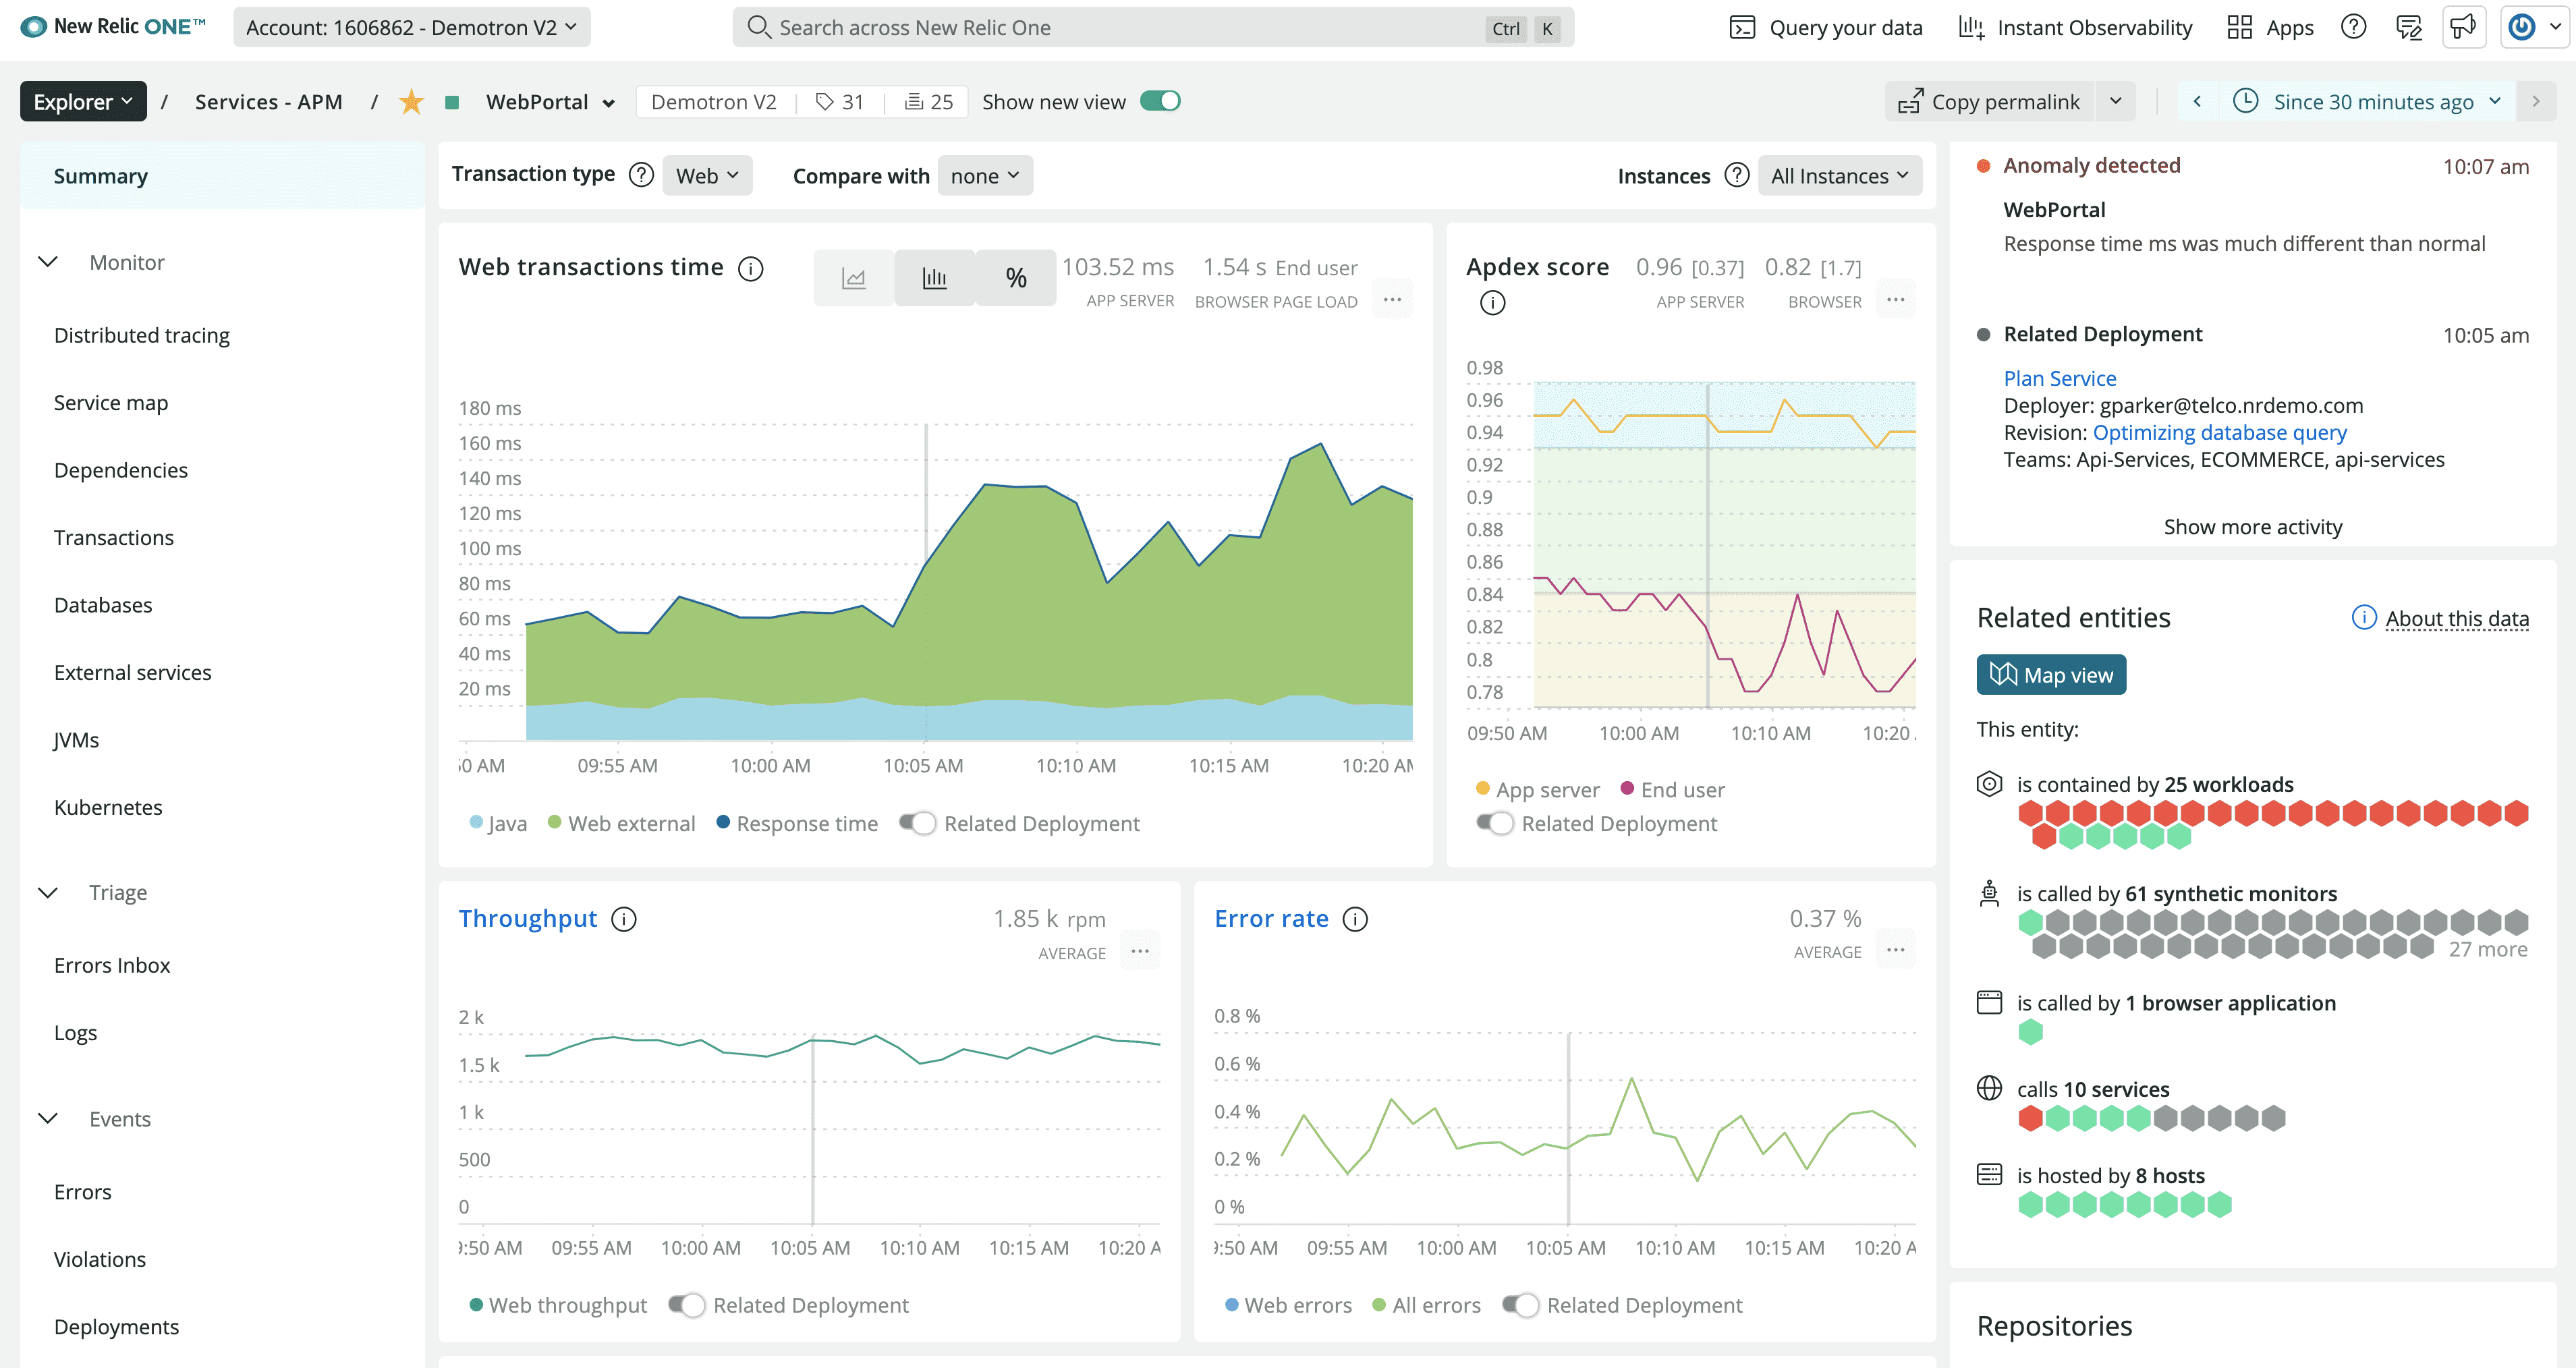
Why New Relic:
- 100 GB Free Forever: Every account includes 100 GB monthly data ingest and one full platform user at no cost
- OpenTelemetry First-Class: Native OTLP support without SDK replacement required
- Unified Platform: APM, infrastructure monitoring, browser monitoring, synthetics, logging in one tool
- AI-Powered Insights: Applied intelligence for anomaly detection and root cause analysis
Key Features:
- Full Stack Observability: Application, infrastructure, browser, mobile, and serverless monitoring
- NRQL Query Language: SQL-like interface for custom dashboards and deep data exploration
- Synthetic Monitoring: Proactive uptime checks and API testing
- Alerts & Workflows: Sophisticated alerting with PagerDuty, Slack integrations
OpenTelemetry Support:
New Relic fully supports OpenTelemetry with native OTLP ingestion. Send standard OTel data without proprietary agents.
Pricing:
- Free Forever: 100 GB data + 1 full platform user + unlimited basic users
- Standard: $10 first user, $99 per additional user (up to 5 users max)
- Pro: $349/user/year ($29/month billed annually) with unlimited users
- Data Ingest: $0.40/GB standard or $0.60/GB Data Plus (includes 90-day retention)
Migration from Application Insights:
Replace Azure Monitor connection with OpenTelemetry OTLP exporter pointing to New Relic endpoint. Application instrumentation code remains unchanged.
Pros:
- ✅ Best free tier in the industry (100 GB sustained)
- ✅ Transparent, predictable pricing model
- ✅ Mature APM with 15+ years of development
- ✅ Strong mobile and browser RUM capabilities
Cons:
- ❌ User-based pricing creates access barriers for large teams
- ❌ Per-GB costs accumulate quickly for high-volume logging
- ❌ UI complexity with overlapping features across products
Best For:
- Small teams leveraging the generous free tier
- Organizations wanting commercial vendor support
- Companies needing strong mobile/browser monitoring
Grafana Cloud: Open Source Observability Platform
Best for: Teams already using Prometheus or Grafana dashboards
Grafana Cloud provides managed Grafana with integrated Prometheus (Mimir), Loki (logs), and Tempo (traces). The platform unifies visualization across all telemetry signals with industry-standard Grafana dashboards.
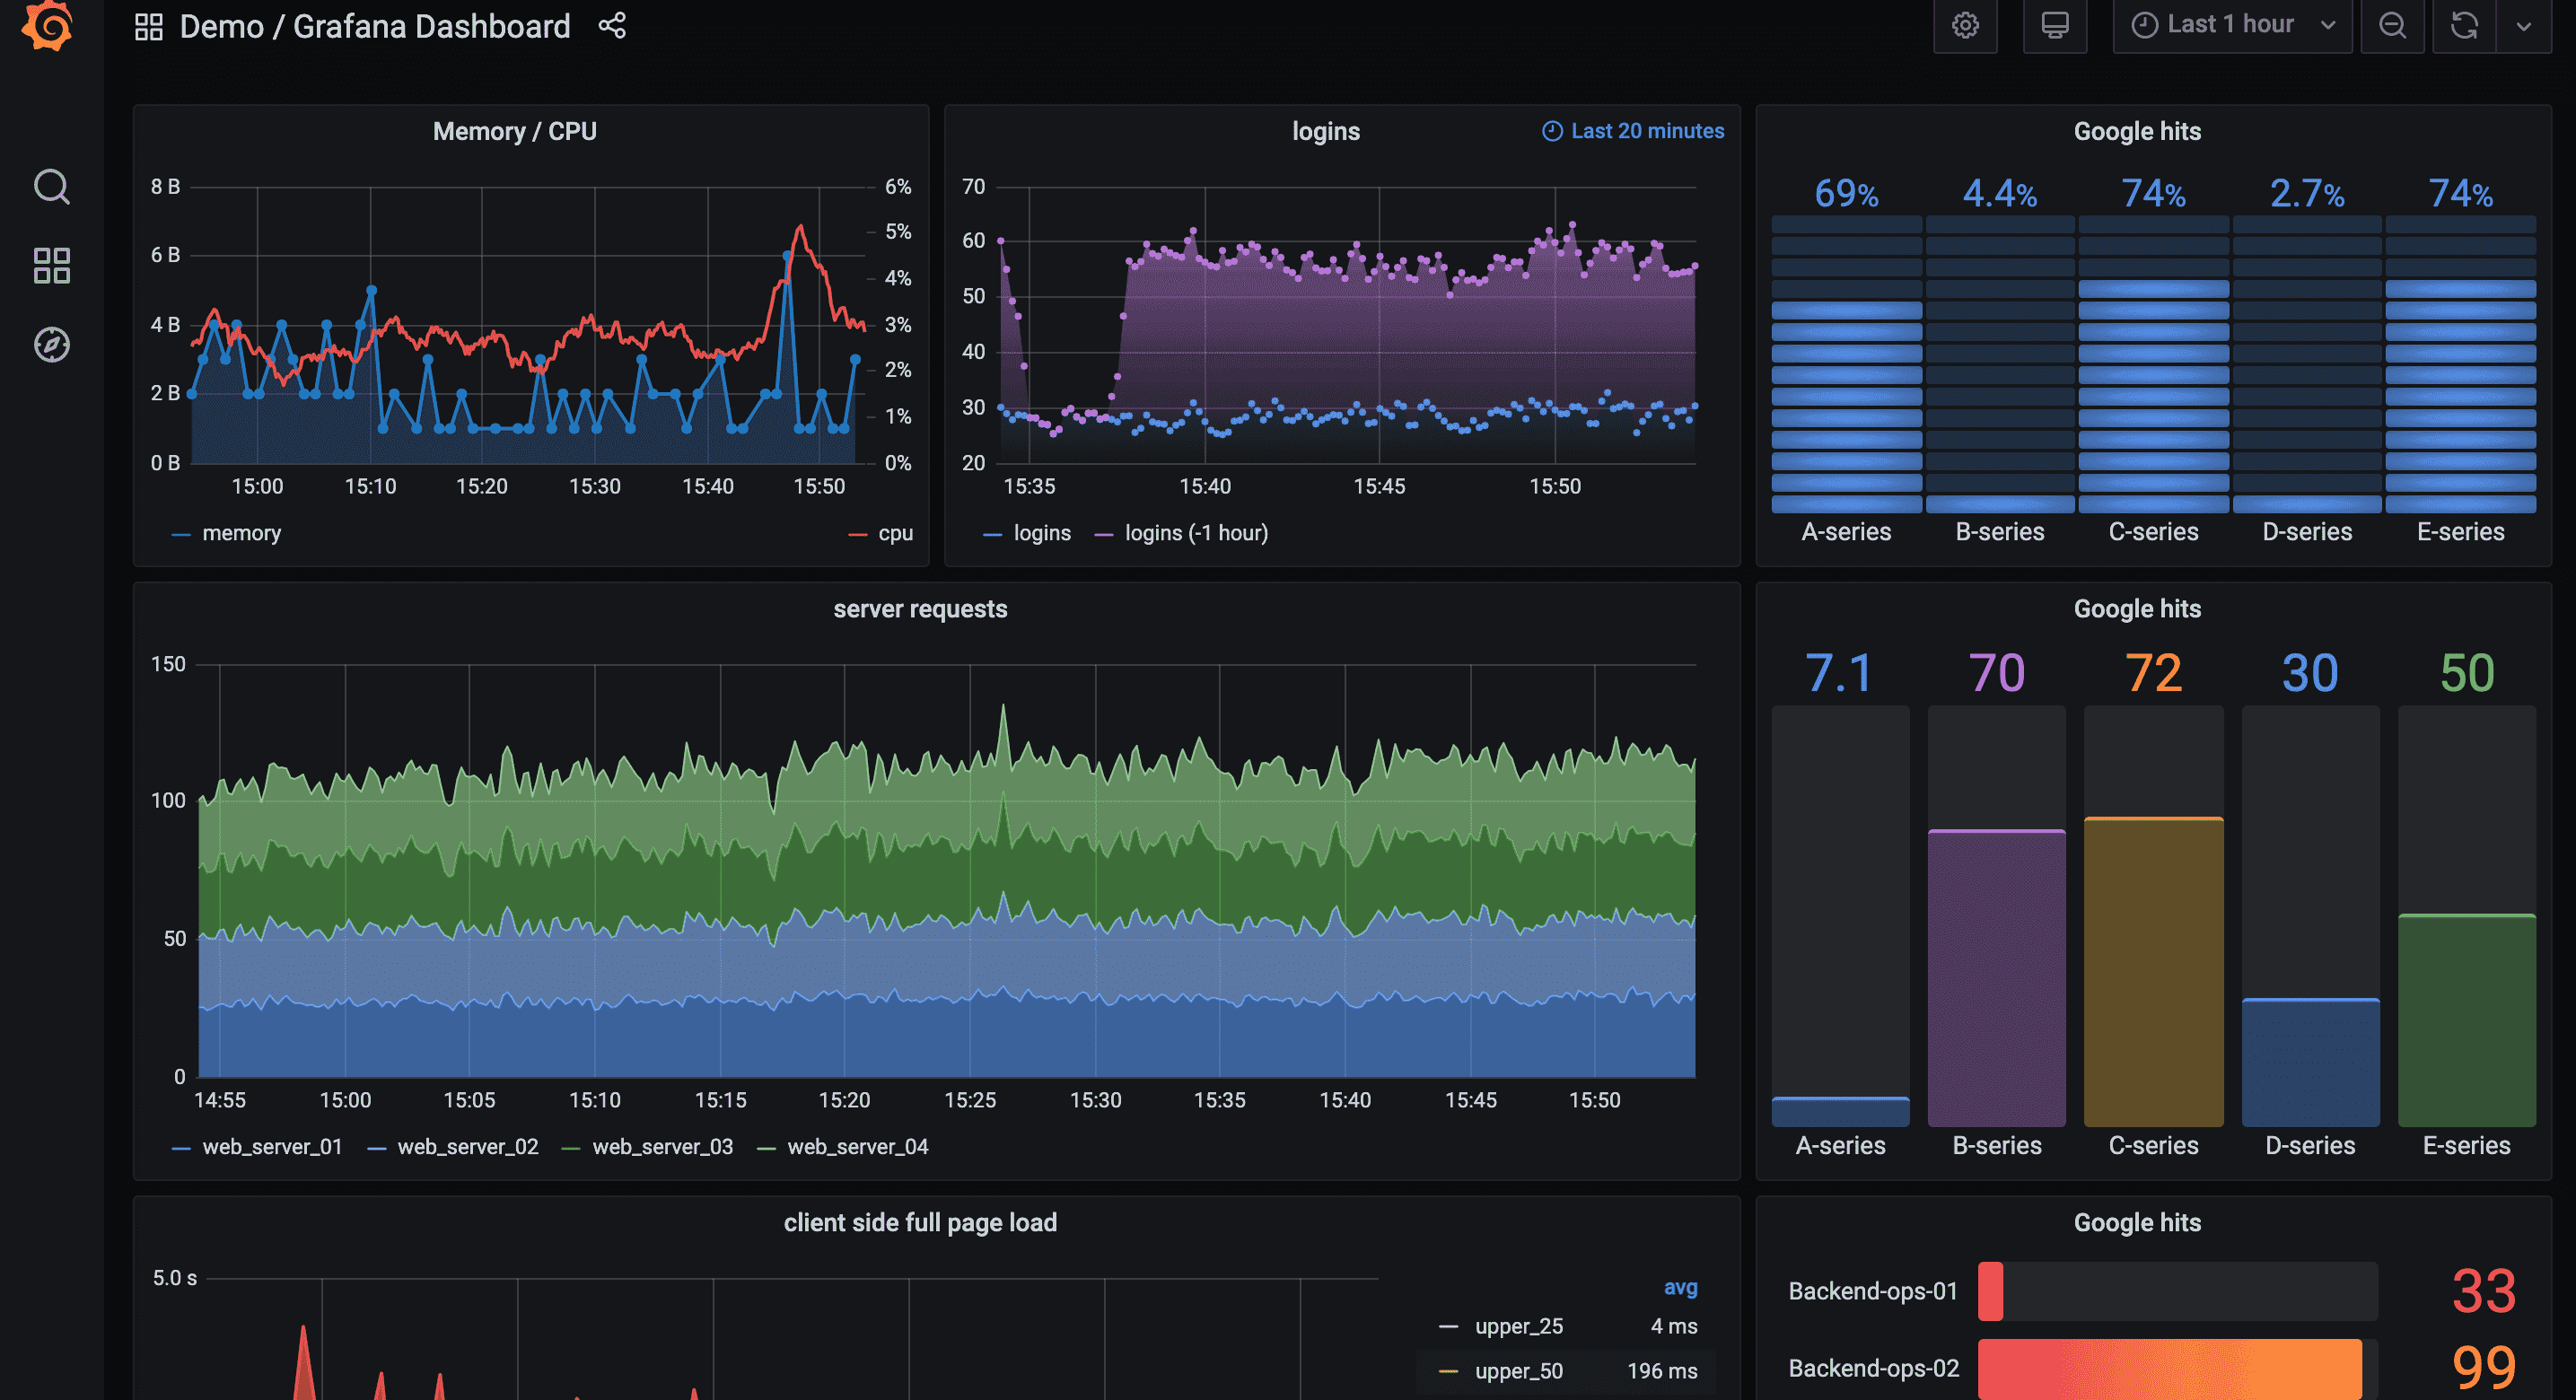
Why Grafana Cloud:
- LGTM Stack: Loki (logs), Grafana (visualization), Tempo (traces), Mimir (metrics) in one platform
- Prometheus Compatible: Native PromQL support with high-performance Mimir backend
- Open Source Foundation: True open source with no proprietary data formats
- Kubernetes Native: Purpose-built for cloud-native infrastructure monitoring
Key Features:
- Unified Visualization: Single Grafana interface for metrics, logs, and traces
- Prometheus Metrics: Scalable long-term Prometheus storage with Grafana Mimir
- Distributed Tracing: OpenTelemetry traces with Grafana Tempo backend
- 1000+ Dashboards: Community-contributed templates for common monitoring scenarios
OpenTelemetry Support:
Tempo accepts OTLP traces natively. Use Grafana Alloy (OpenTelemetry Collector distribution) or standard OTel Collector.
Pricing:
- Free Tier: 50 GB logs, 10,000 metric series, 50 GB traces with 14-day retention
- Pro Tier: $8 per active user/month (Grafana only), $55/user with Enterprise plugins
- Metrics: $8 per 1,000 active series (based on 1 data point per minute)
- Logs/Traces: Volume-based starting ~$0.50/GB
Migration from Application Insights:
Configure Grafana Alloy (OTel Collector distribution) or standard OpenTelemetry Collector with OTLP exporter pointing to Grafana Cloud endpoints.
Pros:
- ✅ Industry-standard Grafana visualization
- ✅ True open source with no proprietary lock-in
- ✅ Excellent Prometheus integration
- ✅ Strong Kubernetes monitoring ecosystem
Cons:
- ❌ Metrics pricing complexity (active series calculations)
- ❌ Separate billing for logs, metrics, traces
- ❌ Enterprise plugins expensive ($55/user)
- ❌ Learning curve for PromQL and LogQL
Best For:
- Teams already using Prometheus or Grafana
- Kubernetes-heavy environments
- Organizations wanting open source foundations with managed hosting
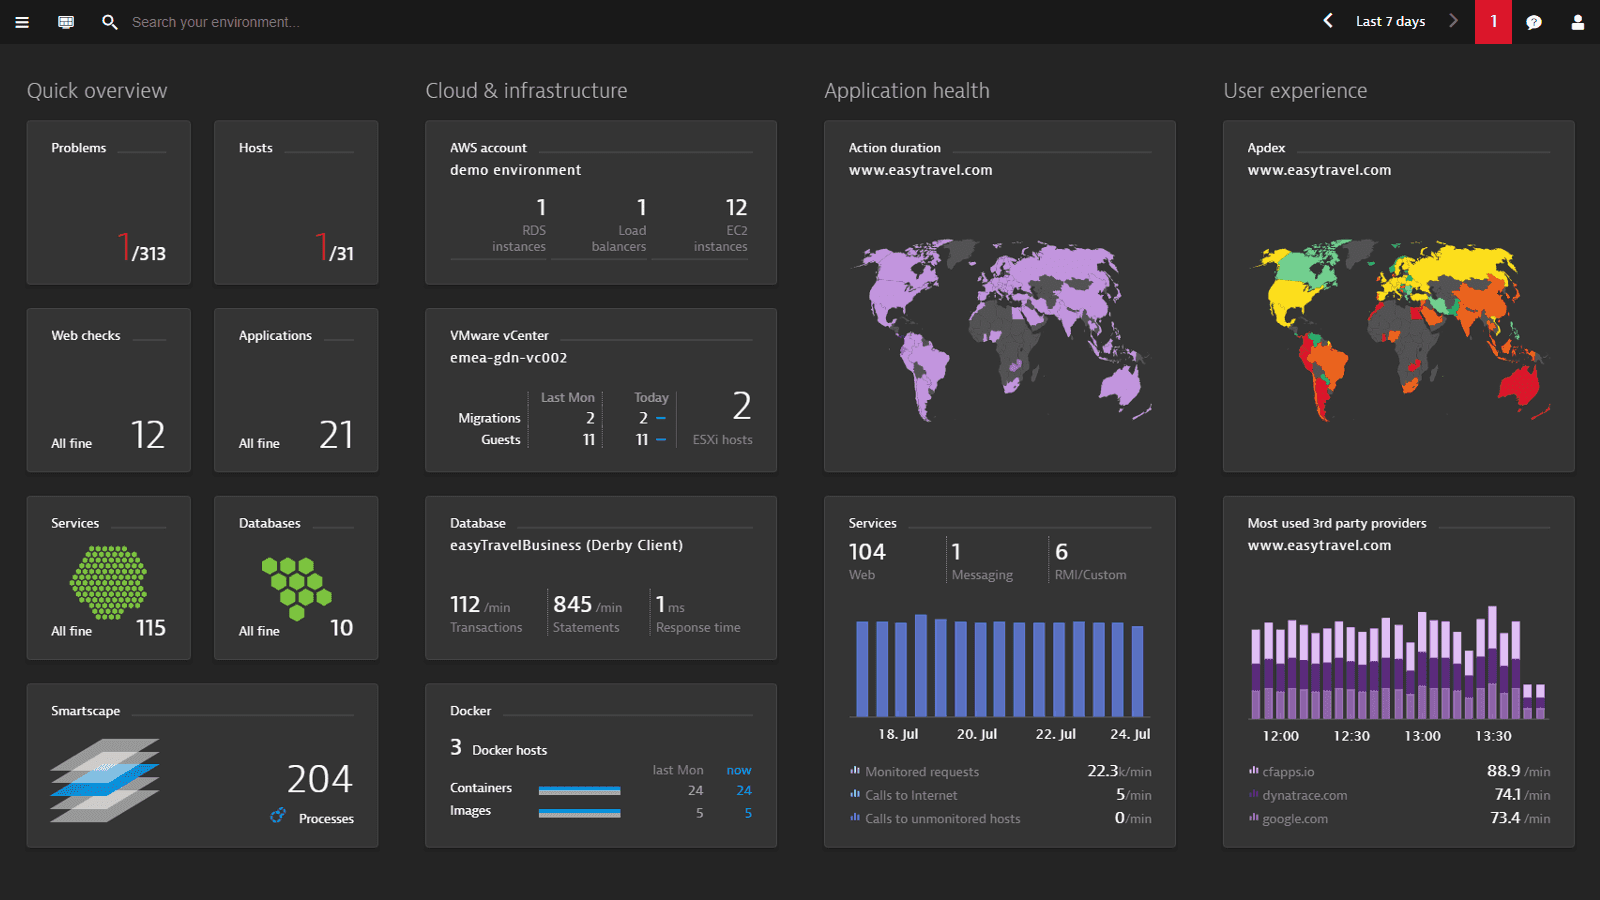
Dynatrace: AI-Powered Enterprise Observability
Best for: Large enterprises requiring automated discovery and AI-driven insights
Dynatrace delivers a unified observability platform powered by the Davis AI engine for automatic anomaly detection, root cause analysis, and predictive alerts. The platform focuses on autonomous operations for complex cloud architectures.
Why Dynatrace:
- Davis AI Engine: Automatically identifies dependencies, detects anomalies, and suggests remediation without manual correlation
- OneAgent Auto-Discovery: Single agent automatically instruments applications, containers, and hosts
- Smartscape Topology: Real-time mapping of service dependencies and infrastructure relationships
- Full Stack Monitoring: End-to-end visibility from infrastructure through user experience
Key Features:
- Autonomous Cloud Operations: Self-healing capabilities for hybrid and multi-cloud environments
- Application Security: Integrated vulnerability scanning and runtime protection
- Business Analytics: Connect technical metrics to business KPIs and revenue impact
- Real User Monitoring: Track actual user experience with session replay
OpenTelemetry Support:
Dynatrace supports OpenTelemetry data ingestion, allowing the Davis AI engine to analyze OTel-collected telemetry. However, OneAgent provides richer metadata than standard OpenTelemetry.
Pricing:
- Full-Stack Monitoring: $0.08 per hour for 8 GiB host (~$58/month per host)
- Infrastructure Only: $0.04 per hour regardless of host size
- Application Security: $0.0165/hour per host
- Enterprise Plans: Custom pricing for large deployments
Migration from Application Insights:
Dynatrace recommends OneAgent for maximum insights, but supports OpenTelemetry through OTLP exporters for vendor-neutral data collection.
Pros:
- ✅ Best-in-class AI-powered automation
- ✅ Zero-configuration auto-discovery
- ✅ Deep integration with 600+ technologies
- ✅ Enterprise-grade support and SLAs
Cons:
- ❌ Most expensive option ($58+/host/month minimum)
- ❌ Complex pricing with multiple add-on costs
- ❌ Proprietary OneAgent preferred over OpenTelemetry
- ❌ Overkill for small teams (typically requires enterprise commitment)
Best For:
- Large enterprises with complex cloud architectures
- Organizations prioritizing AI-driven automation
- Teams managing 100+ microservices requiring autonomous operations
Cost Comparison: 50 Hosts, 500 GB Monthly
Real-world pricing for monitoring 50 application hosts (8GB RAM each), ingesting 500 GB telemetry data per month:
| Provider | Data Cost | Host/User Cost | Monthly Total | Notes |
|---|---|---|---|---|
| Application Insights | $1,150-1,380 | $0 | $1,150-1,380 | Plus Log Analytics costs |
| Uptrace Cloud | $50-75 | $0 | $50-75 | 95% savings |
| Elastic Cloud | $50 | $95 base | $145 | Standard tier |
| New Relic Pro | $200 | $349/year per user | $200 + users | After 100GB free |
| Grafana Cloud | $250-400 | $8-55 per user | $250-650 | Varies by cardinality |
| Dynatrace | Included | $2,900 | $2,900+ | Per-host pricing |
💡 Disclaimer: All prices are indicative and based on common usage scenarios. Actual costs may vary depending on individual agreements, regional pricing, and provider terms.
FAQ
Is Application Insights being deprecated?
No. Microsoft states they have "no plans to stop collecting data from older SDKs" but sees OpenTelemetry as their future direction. However, the classic Application Insights SDK path is no longer recommended for new projects.
Can I use OpenTelemetry with Application Insights?
Yes. Application Insights supports OpenTelemetry through the Azure Monitor OpenTelemetry Distro, but it hasn't reached feature parity with classic SDKs. Many teams experience friction during migration due to incomplete documentation and missing features.
What's the cheapest Application Insights alternative?
Uptrace open source (self-hosted) costs $0 with unlimited scale. For managed services, Uptrace Cloud at $0.10-0.15/GB is 95% cheaper than Application Insights' $2.30-2.76/GB pricing.
Do I need to rewrite applications to switch from Application Insights?
No if you're using OpenTelemetry. The beauty of OpenTelemetry is vendor-neutral instrumentation. Change only the exporter configuration in OpenTelemetry Collector—application code remains untouched.
How does Uptrace compare to Azure Monitor for logs?
Uptrace focuses on structured OpenTelemetry logs with trace correlation. Azure Monitor Log Analytics provides broader Azure service log aggregation (activity logs, diagnostic logs). For application logs, Uptrace offers faster querying with 10-20x data compression via ClickHouse.
Can I run Application Insights and another APM simultaneously?
Yes. The dual-export pattern (shown in migration guide) sends telemetry to multiple backends. Use OpenTelemetry Collector's multi-exporter pipeline to write to Application Insights and your alternative during migration.
What happens to historical Application Insights data?
Application Insights provides 90 days free retention. For longer retention, export to Azure Data Lake Storage or archive critical data before migration. Uptrace cannot import historical Application Insights data directly.
Does Uptrace support Azure-specific integrations like App Service?
Uptrace monitors any application instrumented with OpenTelemetry, regardless of hosting platform (Azure App Service, Kubernetes, VMs, AWS, GCP). However, Azure-native integrations (like automatic instrumentation for Azure Functions) require Azure Monitor.
How can I check my current Application Insights costs before migrating?
Go to Azure Portal → “Monitor” → “Usage and estimated costs”. There, you can see data volumes and estimated charges for each workspace. This helps estimate potential savings before switching to an alternative.
Can I migrate traffic from Application Insights gradually?
Yes. Using OpenTelemetry Collector, you can configure dual-export to send telemetry both to Application Insights and your chosen alternative simultaneously. This allows for a phased migration without any downtime.
Conclusion
Application Insights costs $2.30-2.76/GB with Azure lock-in and OpenTelemetry friction. The five alternatives offer different value propositions:
- Uptrace: Best OpenTelemetry-native solution with 95% cost savings ($0.10-0.15/GB vs $2.30-2.76/GB)
- Elastic APM: Ideal for teams needing log-trace correlation with ELK stack integration
- New Relic: Generous 100 GB free tier with commercial support and transparent pricing
- Grafana Cloud: Perfect for Prometheus users wanting open source foundations
- Dynatrace: Enterprise AI-powered automation at premium pricing ($58+/host/month)
Migration takes 4-6 weeks using OpenTelemetry's dual-export pattern for zero-downtime cutover. Start with Uptrace Cloud free trial or deploy open source to eliminate Application Insights costs permanently.
Related Articles: