Ingesting telemetry using OpenTelemetry Collector
OpenTelemetry Collector is an agent that pulls telemetry data from systems you want to monitor and sends it to tracing tools using the OpenTelemetry protocol (OTLP).
You can use OpenTelemetry Collector to monitor host metrics, PostgreSQL, MySQL, Redis, and more.
Out of the box, Uptrace accepts data from OpenTelemetry Collector using OTLP and automatically creates dashboards for the available metrics.
Sending data from Collector to Uptrace
If you are already using OpenTelemetry Collector, you can configure it to send data to Uptrace using OpenTelemetry Protocol (OTLP).
Don't forget to add Uptrace exporter to service.pipelines section. Unused receivers and exporters are silently ignored.
Cloud
To send data to Uptrace Cloud:
processors:
  resourcedetection:
    detectors: [env, system]
  cumulativetodelta:
  batch:
    send_batch_size: 10000
    timeout: 10s

exporters:
  otlp/uptrace:
    endpoint: api.uptrace.dev:4317
    headers:
      uptrace-dsn: '<FIXME>'

service:
  pipelines:
    traces:
      receivers: [otlp]
      processors: [batch]
      exporters: [otlp/uptrace]
    metrics:
      receivers: [otlp]
      processors: [cumulativetodelta, batch, resourcedetection]
      exporters: [otlp/uptrace]
    logs:
      receivers: [otlp]
      processors: [batch]
      exporters: [otlp/uptrace]
Debugging issues
If otelcol is not working as expected, you can check the log output for potential issues. The logging verbosity level defaults to INFO, but you can change it using the configuration file:
service:
  telemetry:
    logs:
      level: 'debug'
Sending data from Uptrace distros to Collector
Sometimes it might be useful to send data from Uptrace distros to an OpenTelemetry Collector acting as a middle-man that forwards the received data to Uptrace.
For example, you can use OpenTelemetry Collector in such a manner for tail-based sampling or redacting span attributes.
Assuming your local OpenTelemetry Collector is listening on localhost:4317 (OTLP/gRPC) and localhost:4318 (OTLP/HTTP), use the following Uptrace DSN to configure Uptrace distros:
# For distros that use OTLP/gRPC exporter.
UPTRACE_DSN=http://localhost:4317

# or

# For distros that use OTLP/HTTP exporter.
UPTRACE_DSN=http://localhost:4318
If the Collector supports TLS, replace http with https.
Host metrics
hostmetricsreceiver is an OpenTelemetry Collector plugin that gathers various metrics about the host system, for example, CPU, RAM, disk metrics and other system-level metrics.
See OpenTelemetry Host Metrics receiver for details.
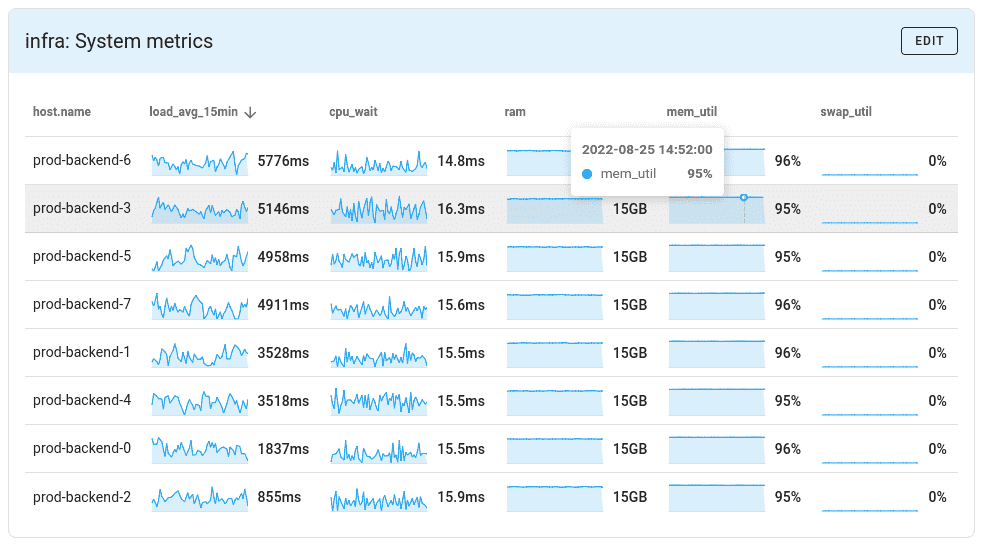
Dashboards
Once everything is configured properly, Uptrace will automatically create dashboards using pre-built templates:
What's next?
Next, learn more about OpenTelemetry Collector or browse available receivers.
- OTel Arrow - Reduce bandwidth by up to 50% using Apache Arrow columnar format
- OpenTelemetry Kubernetes
- OpenTelemetry Docker
- OpenTelemetry Redis
- OpenTelemetry PostgreSQL
- OpenTelemetry MySQL
- OpenTelemetry Kafka
- OpenTelemetry PHP-FPM