What is O11y? Guide to Modern Observability
Distributed architectures with microservices, cloud-native components, and service meshes make traditional monitoring methods inadequate for system analysis. O11y (observability) implements advanced telemetry frameworks for deep system introspection through metrics, traces, and logs collection. This programmatic approach enables real-time debugging, performance optimization, and architectural decisions across distributed environments. O11y patterns allow teams to instrument applications for exposing internal states, tracking cross-service request flows, and correlating system behaviors during root cause analysis.
Why You Need O11y
The transition from traditional monitoring to o11y is driven by several key factors:
- Increasing system complexity
- Microservices architecture adoption
- Cloud-native deployments
- Need for faster problem resolution
- Customer experience demands
- Cost optimization requirements
For organizations heavily reliant on data pipelines and analytics, data observability provides specialized capabilities for ensuring data quality and reliability.
What is O11y?
O11y (observability) acts as your system's self-diagnostic mechanism. By embedding telemetry collection points throughout your code, o11y reveals how your applications behave in production. Written as "o11y" (11 letters between 'o' and 'y'), this approach transforms raw system data into actionable insights through automated instrumentation, making complex troubleshooting possible even in distributed environments.
Key Differences from Traditional Monitoring
| Aspect | Traditional Monitoring | O11y |
|---|---|---|
| Focus | Known failures | Unknown issues |
| Data Collection | Pre-defined metrics | High-cardinality data |
| Analysis | Threshold-based | Exploratory analysis |
| Scope | System health | Full system behavior |
| Implementation | Top-down | Bottom-up |
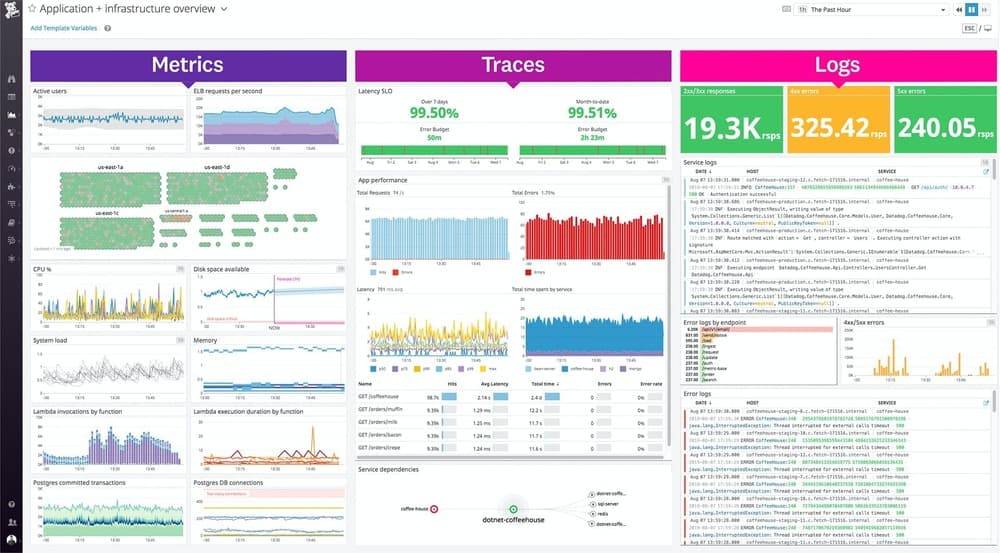
The Three Pillars of O11y: Metrics, Logs, and Traces
Modern observability relies on three fundamental data types that work together to provide comprehensive system insights. Let's explore each pillar in detail.
Metrics: System Performance Quantified
Metrics represent numerical measurements collected over time. They provide statistical data about system behavior and performance.
Key Metric Types
| Metric Category | Metric Type | Description | Common Units |
|---|---|---|---|
| Resource Metrics | CPU Utilization | System processor usage | % |
| Memory Usage | RAM consumption and allocation | MB/GB | |
| Disk I/O | Storage operations speed | IOPS | |
| Network Throughput | Data transfer rate | MB/s | |
| Connection Pools | Active/idle connections | Count | |
| Application Metrics | Request Rate | System load | RPS/TPS |
| Error Rate | Failed operations | % | |
| Response Time | Service latency | ms | |
| Queue Length | Pending operations | Count | |
| Cache Performance | Storage efficiency | Hit ratio % | |
| Business Metrics | User Sessions | Active users | Count |
| Transactions | Completed business operations | Rate/hour | |
| Revenue | Financial indicators | USD/EUR | |
| Feature Usage | Product adoption | Usage % | |
| User Experience | Customer satisfaction | Score (1-10) |
Metric Collection Patterns
# Example of metric instrumentation using OpenTelemetry
from opentelemetry import metrics

# Create a meter
meter = metrics.get_meter("payment_service")

# Create counters and gauges
request_counter = meter.create_counter(
    name="payment_requests",
    description="Number of payment requests",
    unit="1"
)

latency_histogram = meter.create_histogram(
    name="payment_duration",
    description="Payment processing duration",
    unit="ms"
)
Logs: Contextual Event Records
Logs provide detailed records of discrete events within your system. They capture the what, when, and why of system behavior.
Log Levels and Usage
| Level | Usage | Example |
|---|---|---|
| ERROR | System failures | Database connection lost |
| WARN | Potential issues | High memory usage |
| INFO | Normal operations | Request processed |
| DEBUG | Detailed states | Cache miss occurred |
| TRACE | Fine-grained data | Function entry/exit |
Structured Log Example
{
  "timestamp": "2025-12-09T10:15:30.452Z",
  "level": "ERROR",
  "service": "payment-processor",
  "trace_id": "abc123def456",
  "span_id": "789ghi",
  "message": "Payment transaction failed",
  "context": {
    "user_id": "user123",
    "amount": 99.99,
    "currency": "USD",
    "payment_method": "credit_card",
    "error_code": "INSUFFICIENT_FUNDS"
  },
  "stack_trace": "...",
  "host": "payment-pod-abc-123",
  "environment": "production"
}
Traces: Request Journey Mapping
Traces track requests as they flow through distributed systems, providing timing and dependency information. For a comprehensive understanding, see our complete guide to OpenTelemetry distributed tracing.
Trace Components Structure
| Component Type | Element | Description | Purpose |
|---|---|---|---|
| Spans | Operation Representation | Atomic unit of work | Captures individual service actions |
| Timing Data | Duration and timestamps | Measures operation performance | |
| Operation Metadata | Tags and attributes | Provides context for analysis | |
| Parent/Child Links | Hierarchical relationships | Maps request flow paths | |
| Context Propagation | Trace ID | Unique identifier | Links distributed operations |
| Baggage Items | Key-value pairs | Carries request-scoped data | |
| Correlation IDs | Reference identifiers | Connects related operations | |
| Custom Attributes | User-defined metadata | Adds business context |
Detailed Trace Example
trace:
  id: abc123def456
  name: 'process_payment'
  start_time: '2025-12-09T10:15:30.000Z'
  duration: 250ms
  spans:
    - name: 'http.request'
      service: 'api-gateway'
      duration: 250ms
      attributes:
        http.method: 'POST'
        http.url: '/api/v1/payments'
      events:
        - name: 'auth_start'
          timestamp: '2025-12-09T10:15:30.050Z'
      child_spans:
        - name: 'user.validate'
          service: 'auth-service'
          duration: 50ms
          attributes:
            user.id: 'user123'

        - name: 'database.query'
          service: 'payment-service'
          duration: 100ms
          attributes:
            db.system: 'postgresql'
            db.statement: 'SELECT * FROM payments'

        - name: 'payment.process'
          service: 'payment-processor'
          duration: 75ms
          attributes:
            payment.type: 'credit_card'
            payment.amount: 99.99
Integration Patterns
The real power of o11y comes from correlating data across all three pillars:
- Metric-to-Log Correlation
- High error rate metrics trigger log analysis
- Resource utilization spikes link to error logs
- Performance degradation investigation
- Log-to-Trace Correlation
- Error logs link to trace contexts
- Business transaction tracking
- User session analysis
- Trace-to-Metric Correlation
- Service latency analysis
- Error pattern detection
- Resource consumption tracking
Tools You'll Actually Use
The o11y ecosystem includes various tools for collecting, processing, and visualizing telemetry data. Let's explore key open-source and commercial options, starting with community-driven solutions that provide robust observability capabilities.
Open Source Solutions
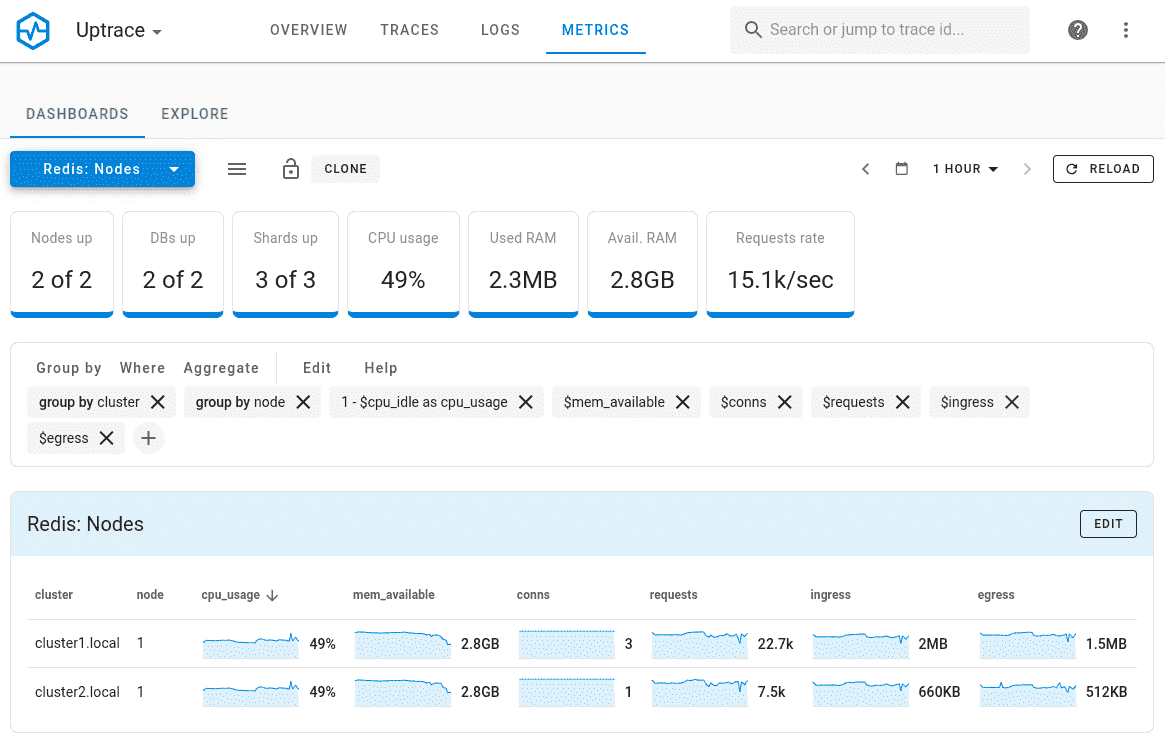
Uptrace
Uptrace is a complete observability platform built natively for OpenTelemetry. Combines metrics, traces, and logs with SQL-based querying capabilities. Offers automated instrumentation, efficient resource usage, and cost-effective scaling for growing systems.
OpenTelemetry
OpenTelemetry is a core instrumentation framework that provides standardized data collection across all services. What is OpenTelemetry? - learn core concepts, components, and implementation approaches. Features vendor-neutral APIs, automatic instrumentation, and supports multiple languages. Essential for implementing consistent observability across distributed systems.
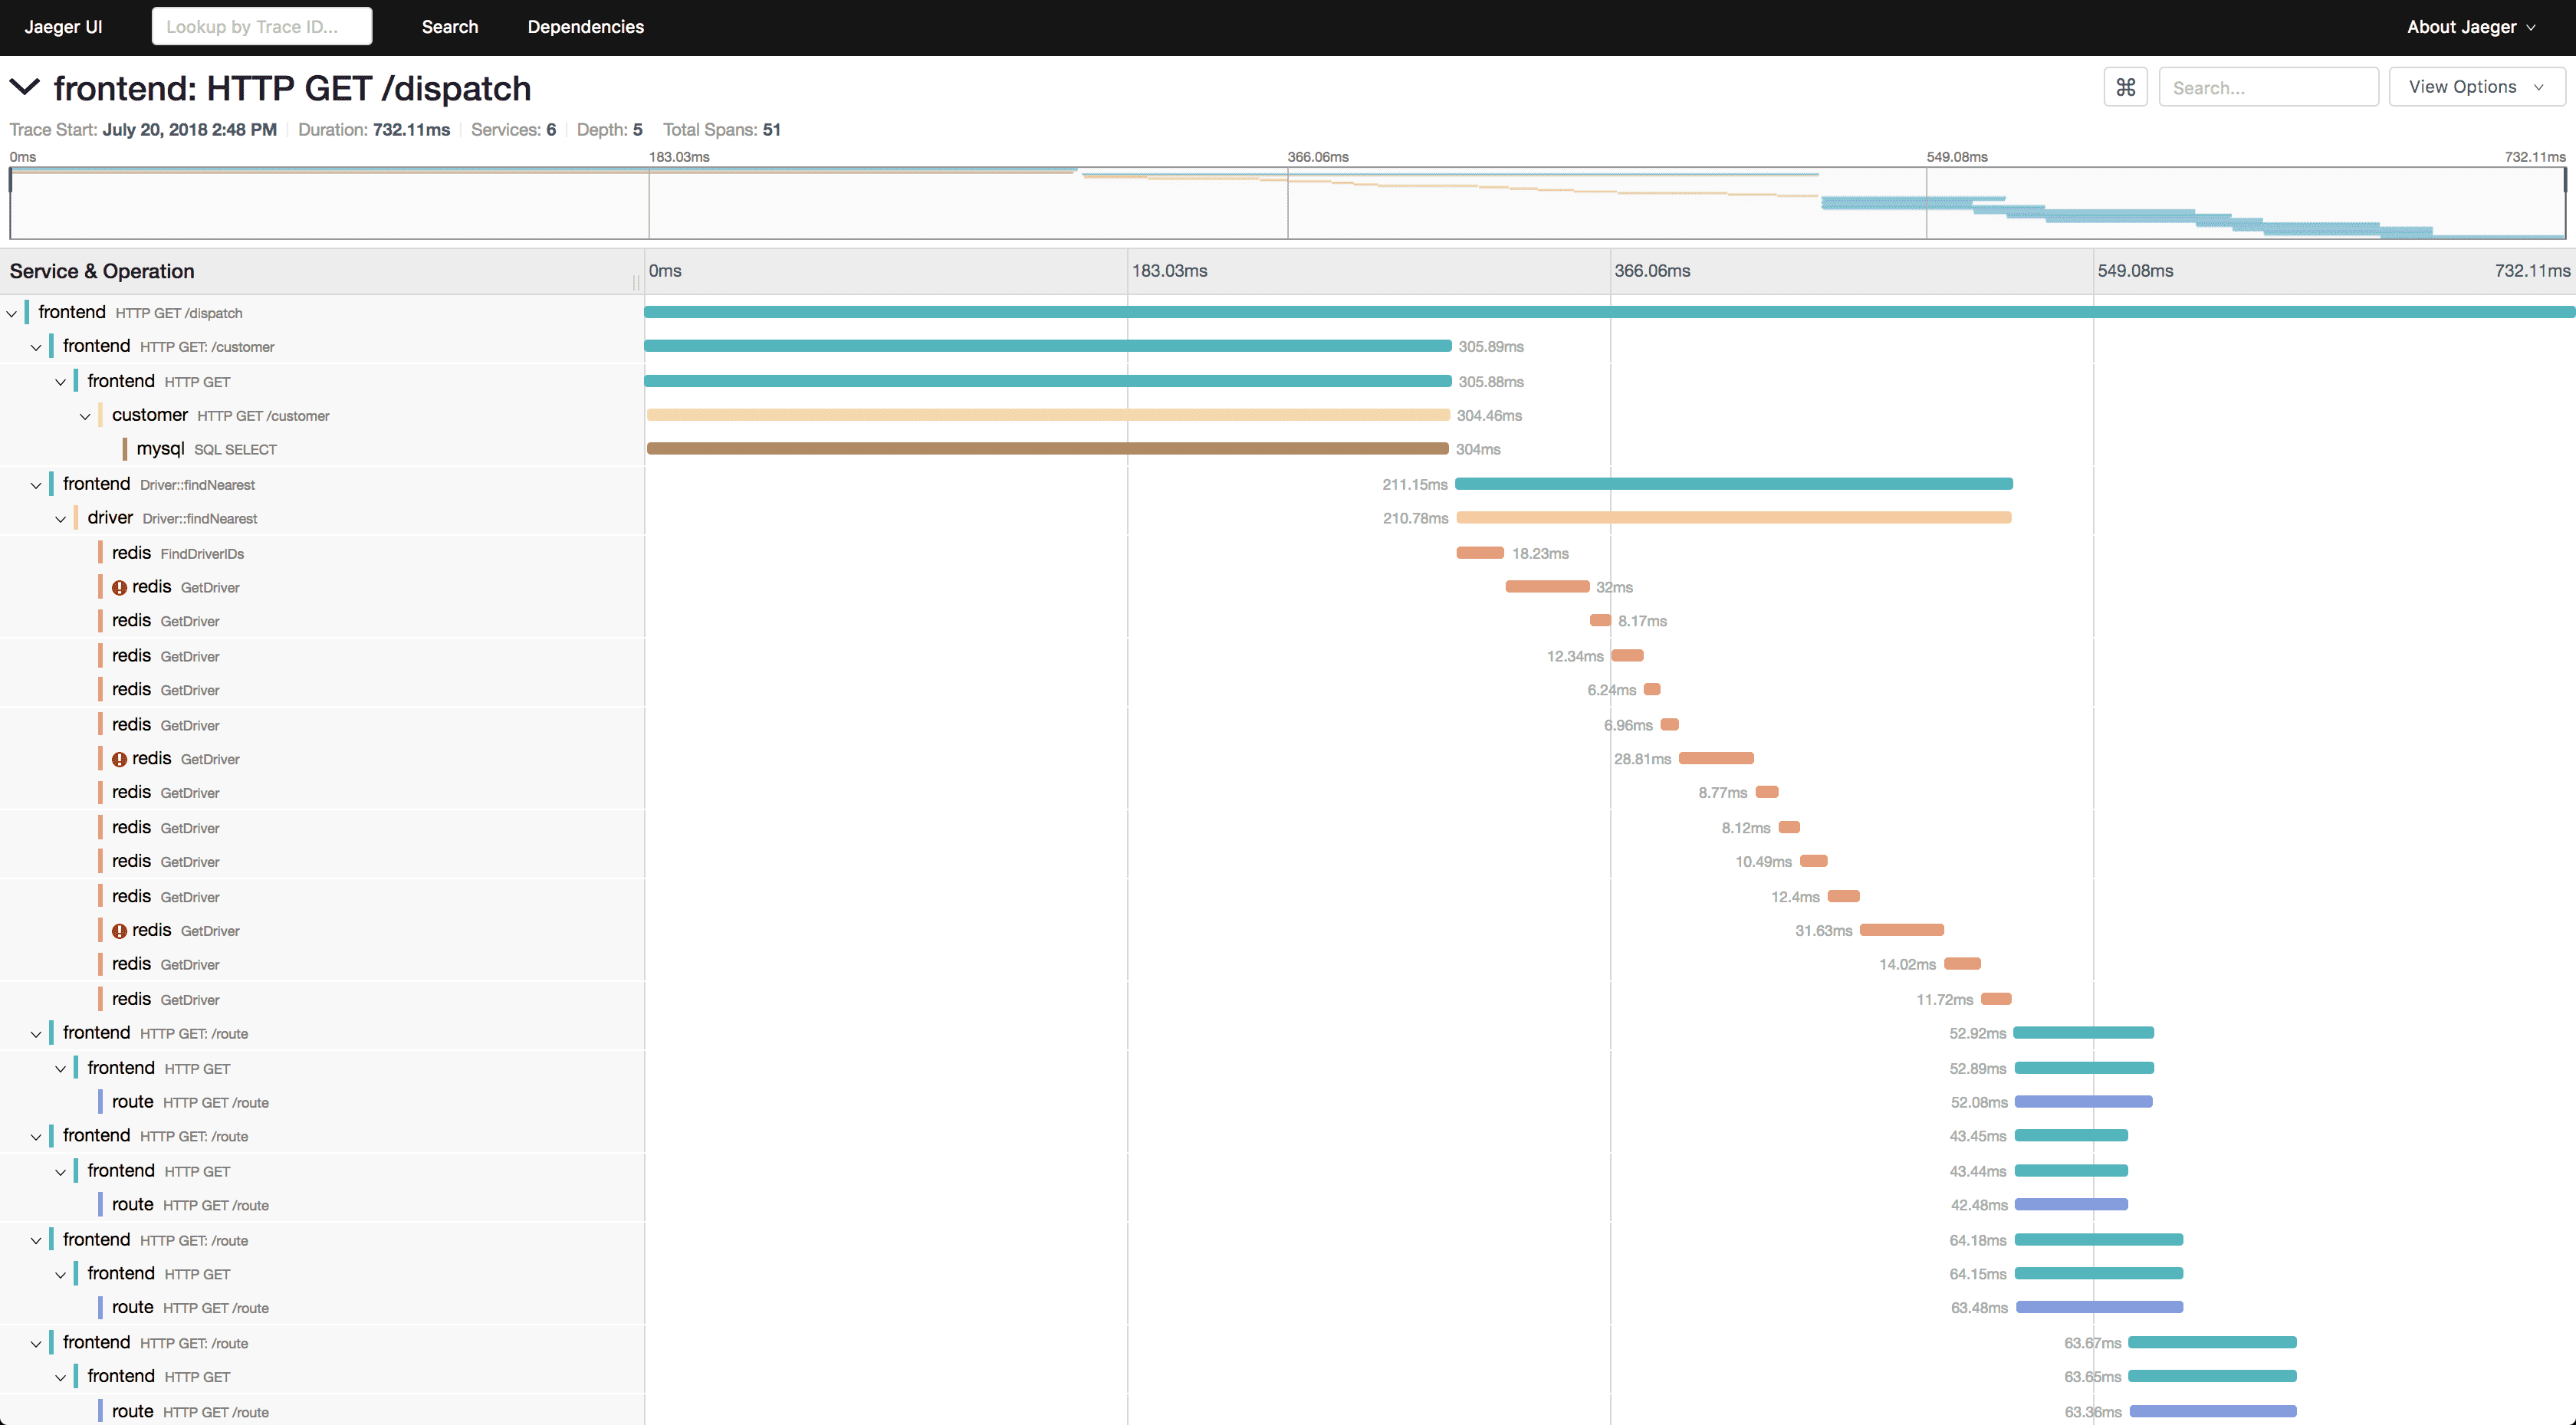
Jaeger
Jaeger is a distributed tracing system built for microservices environments. Learn more about Jaeger - from core concepts to advanced implementation patterns. Excels at end-to-end transaction monitoring, dependency analysis, and performance optimization. Provides powerful query capabilities and sampling strategies for large-scale deployments.

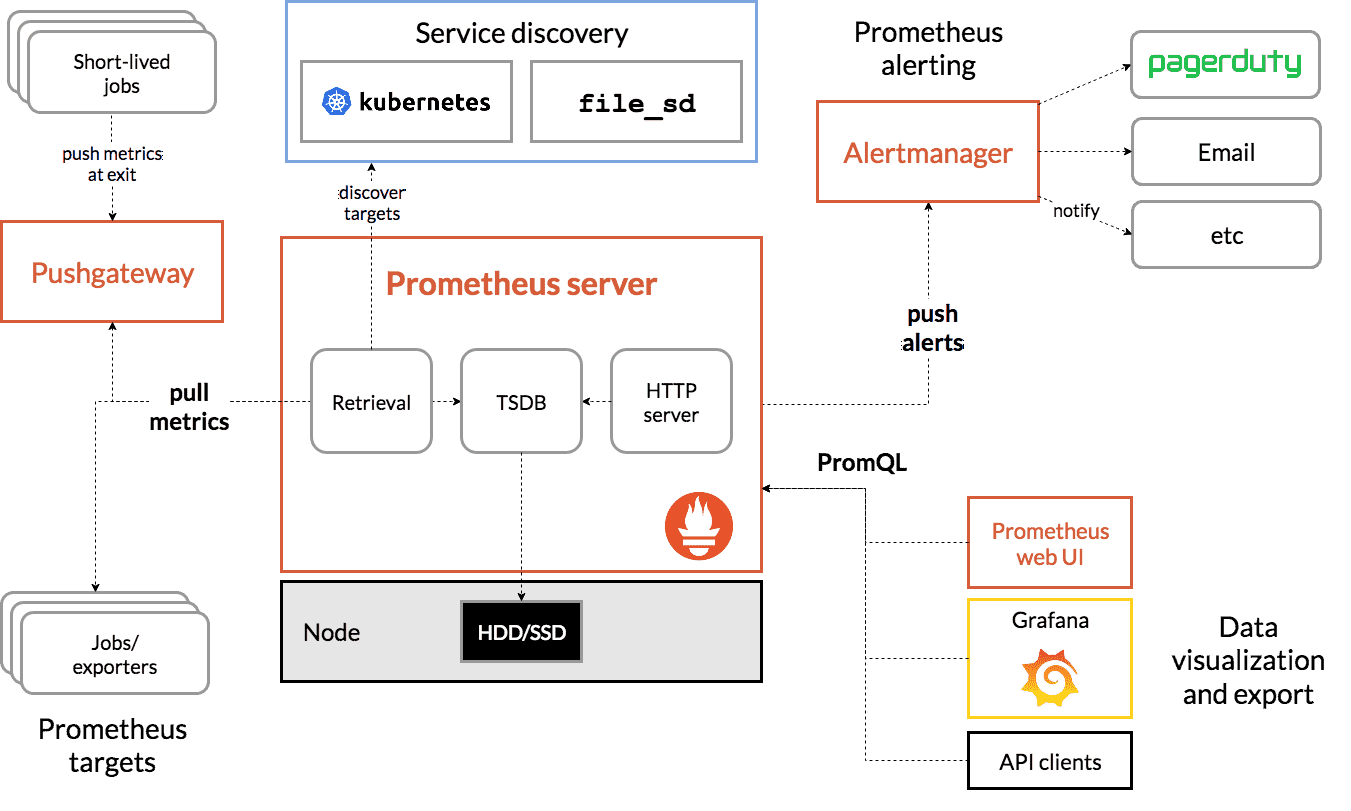
Prometheus
Prometheus specializes in metrics collection and alerting. Uses a pull-based architecture with powerful PromQL query language. Ideal for system metrics, custom metrics collection, and setting up comprehensive alerting rules. Learn how to ingest Prometheus metrics into Uptrace for unified observability.
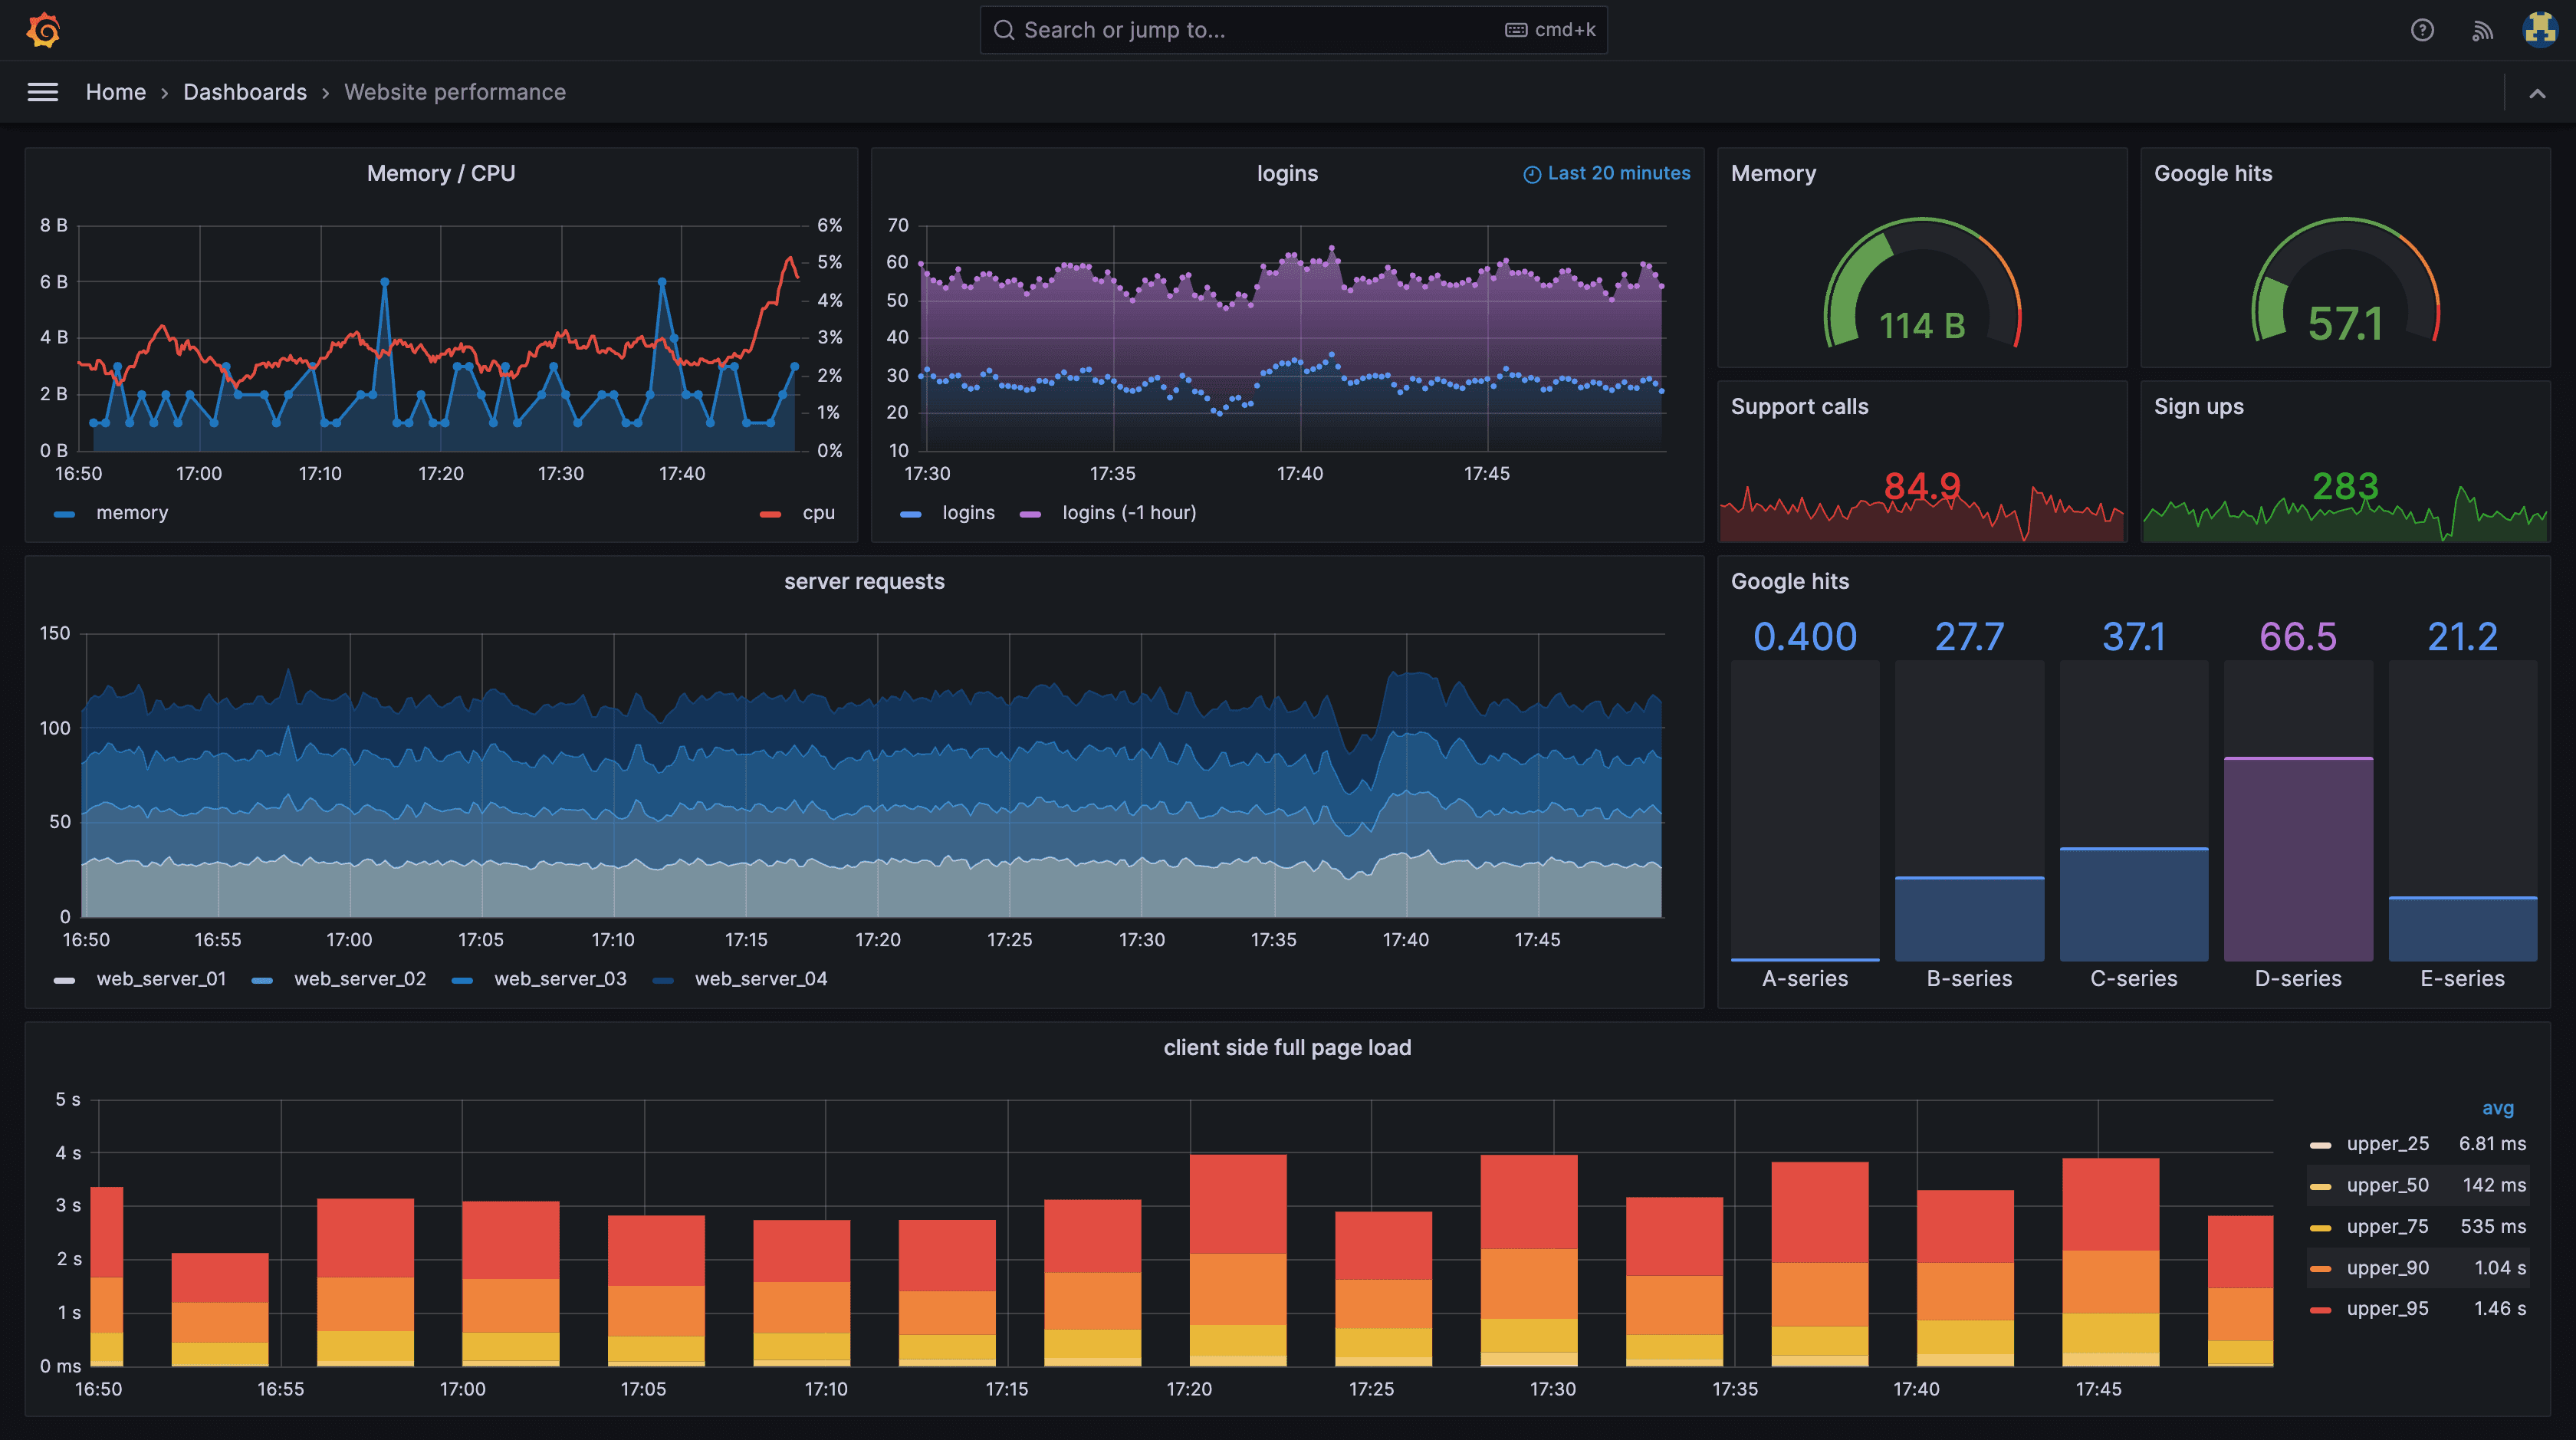
Grafana
Grafana serves as the industry-standard visualization platform that connects to multiple data sources. Creates sophisticated dashboards, supports alerting integration, and enables deep data exploration through custom panels and templates.
Commercial Platforms
Datadog
Datadog offers an enterprise-grade platform with comprehensive monitoring capabilities. Provides extensive integration options, machine learning-powered analytics, and robust infrastructure monitoring. Best suited for large organizations with complex requirements and diverse technology stacks. Looking for alternatives? Check our guide to top 9 open source Datadog alternatives.
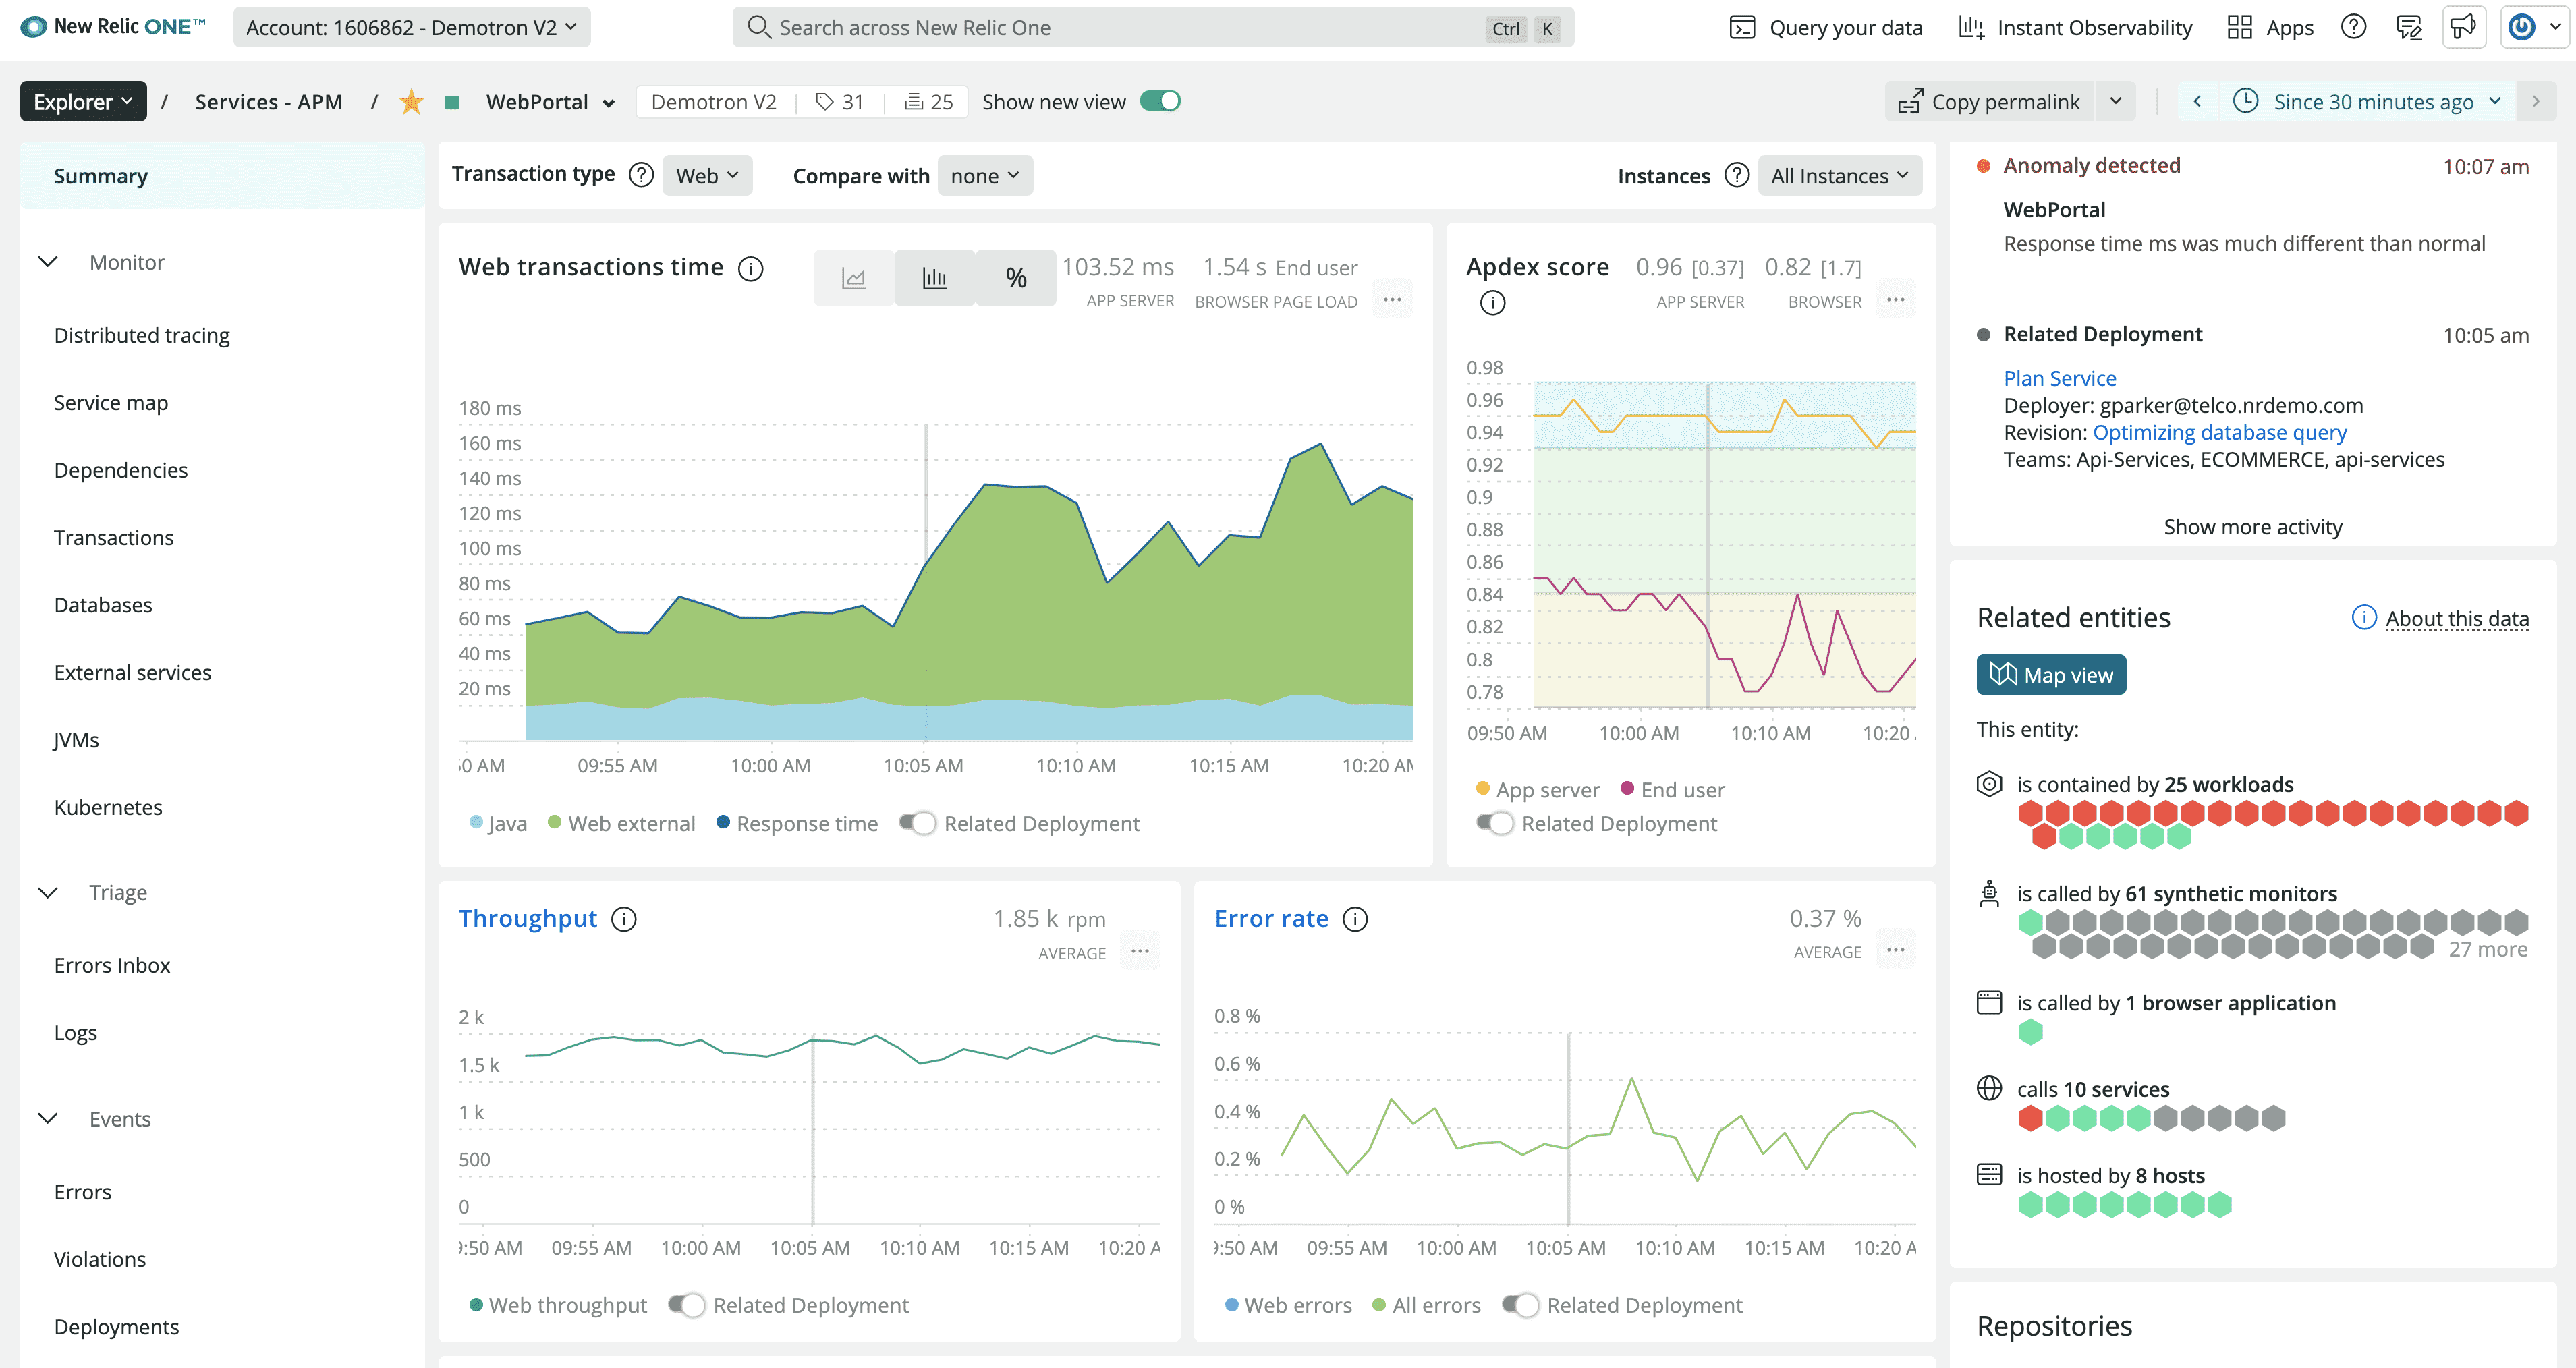
New Relic
New Relic delivers a full-stack observability platform with strong APM capabilities. Features detailed transaction tracing, custom dashboards, and integrated error tracking. Popular among mid-size to large organizations requiring detailed performance insights. Explore top 5 New Relic alternatives, including open-source options. Migrating away? Follow the Get New Relic migration guide to move telemetry and dashboards safely.
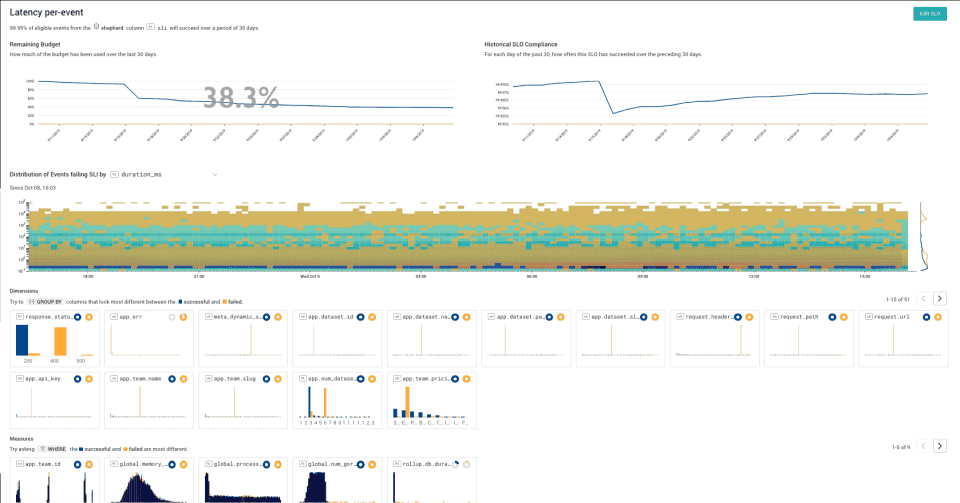
Honeycomb
Honeycomb focuses on high-cardinality observability and debugging workflows. Offers powerful event-driven analysis capabilities and fast query response times. Particularly effective for teams focused on rapid debugging and incident response.
Feature Comparison Matrix
| Feature | Uptrace | Datadog | New Relic | Honeycomb |
|---|---|---|---|---|
| OpenTelemetry Support | Native | Partial | Partial | Partial |
| Trace Sampling | Intelligent | Basic | Advanced | Advanced |
| Query Language | SQL | Custom | NRQL | Custom |
| Auto-instrumentation | Yes | Limited | Yes | Limited |
| Custom Dashboards | Yes | Yes | Yes | Yes |
| Free Tier | Yes | Limited | Limited | Limited |
| Enterprise Support | Yes | Yes | Yes | Yes |
| Setup Complexity | Low | High | High | Medium |
Cost-Benefit Analysis
| Tool | Initial Investment | Scaling Costs | ROI Factors |
|---|---|---|---|
| Open Source Stack | High setup time | Infrastructure costs | • Full control • No vendor lock-in |
| Uptrace | Low setup time | Predictable pricing | • Quick implementation • Cost-effective scaling |
| Enterprise Solutions | High setup + license | Variable, often expensive | • Comprehensive features • Enterprise support |
Implementation Guide
O11y implementation requires strategic planning and systematic execution. Each phase builds upon the previous one, establishing a robust observability framework that scales with your system's complexity.
Phase 1: Foundation
- Instrument your application
- Configure data collection
- Set up basic visualization
- Establish baseline metrics
Phase 2: Advanced Features
- Implement distributed tracing
- Create custom dashboards
- Set up alerting
- Define SLOs
Best Practices for O11y Implementation
Effective o11y requires thoughtful implementation and consistent practices across your organization. These guidelines help establish reliable data collection and analysis workflows while avoiding common pitfalls.
Data Collection
- Use structured logging
- Implement consistent tracing
- Choose relevant metrics
- Enable context propagation
Tool Selection Criteria
| Criterion | Importance | Considerations |
|---|---|---|
| Scalability | High | Data volume handling |
| Ease of Use | Medium | Learning curve |
| Integration | High | Tool compatibility |
| Cost | Medium | Per-user/data pricing |
| Support | High | Community/commercial |
Performance Impact Considerations
System observability must balance comprehensive data collection with minimal performance overhead. Understanding these impacts enables optimal instrumentation strategies.
| Component | Impact | Mitigation |
|---|---|---|
| Tracing | Low-Medium | Sampling |
| Metrics | Very Low | Aggregation |
| Logging | Medium | Level filtering |
Security and Compliance
Implementing o11y in regulated environments requires careful consideration of security measures and compliance requirements. Security controls must protect sensitive data while maintaining observability effectiveness.
Data Protection
Modern o11y implementations process vast amounts of telemetry data, requiring robust security measures. Data protection starts with secure collection points and extends through the entire observability pipeline. PII handling demands special attention, implementing masking and encryption for sensitive fields before storage. Access controls should follow the principle of least privilege, with role-based access controlling both data collection and visualization capabilities.
Organizations must implement comprehensive audit logging to track data access and system changes. This creates an audit trail for security investigations and compliance reporting. End-to-end encryption protects data both in transit and at rest, using industry-standard protocols and key management practices.
Compliance Requirements
GDPR compatibility requires careful handling of personal data within observability systems. This includes implementing data minimization principles, ensuring data subject rights, and maintaining detailed processing records. Organizations must be able to identify and extract personal data on request.
SOC 2 considerations focus on the security, availability, and confidentiality of observability data. This requires implementing controls around data collection, storage, and access. Regular audits verify the effectiveness of these controls.
Industry-specific standards may impose additional requirements. Healthcare organizations must ensure HIPAA compliance, while financial institutions need to meet PCI DSS standards. Each industry framework requires specific security controls and documentation.
| Security Aspect | Implementation Requirements | Compliance Impact |
|---|---|---|
| Data Collection | Secure endpoints, encryption | GDPR, SOC 2 |
| Storage | Encrypted volumes, access logs | PCI DSS, HIPAA |
| Access Control | RBAC, audit trails | SOC 2, ISO 27001 |
| Data Retention | Policy enforcement, cleanup | GDPR, Industry specific |
Cost Analysis
Understanding the financial impact of o11y implementation helps organizations plan effective investments and measure returns. Proper cost analysis considers both direct expenses and long-term benefits.
Implementation Costs
Initial implementation requires strategic investment across several key areas:
| Cost Category | Description | Typical Range | Cost Factors |
|---|---|---|---|
| Tool Licensing | Platform and software fees | $0-100k/year | • Team size • Data volume • Feature requirements |
| Infrastructure | Hardware and cloud resources | $5-50k/month | • Data retention • Query volume • High availability needs |
| Training | Team skill development | $10-30k/quarter | • Team expertise • Learning resources • Workshop costs |
| Maintenance | Ongoing system upkeep | 15-25% of initial cost | • System complexity • Update frequency • Support requirements |
ROI Calculations
Organizations typically see returns in three major areas:
Incident Reduction
- Mean Time to Detection (MTTD): 40-60% improvement
- Mean Time to Resolution (MTTR): 50-70% reduction
- Incident frequency: 30-50% decrease annually
- Customer impact: 45-65% reduction in affected users
Performance Improvements
- System latency: 20-40% reduction
- Resource utilization: 30-50% optimization
- Application throughput: 15-35% increase
- Error rates: 25-45% reduction
Resource Optimization
- Infrastructure costs: 20-35% savings
- Team efficiency: 30-50% improvement
- Automation potential: 40-60% increase
- Capacity planning accuracy: 35-55% improvement
Cost Optimization Strategies
- Phased Implementation Start with critical systems and expand based on measured value.
- Data Management Implement intelligent sampling and retention policies to control storage costs.
- Tool Selection Begin with open-source solutions like OpenTelemetry and Uptrace, scaling to enterprise tools as needed.
- Resource Planning Right-size infrastructure based on actual usage patterns and growth projections.
FAQ
- What's the typical implementation timeline for o11y? Implementation timeframes vary by organization size and complexity. Small teams can achieve basic implementation in 3-4 weeks, while enterprise environments typically require 4-6 months for comprehensive coverage. Initial metrics collection can start within days, with tracing and advanced features following gradually.
- How does o11y differ from traditional APM solutions? While APM focuses on application performance metrics, o11y provides deeper system insights through correlation of metrics, logs, and traces. O11y enables unknown-unknown problem discovery, whereas APM typically monitors known failure modes and performance indicators.
- What's the data storage requirement for o11y? Storage requirements vary based on traffic volume and retention policies. Typically, organizations need:
- Metrics: 1-2GB per day per 100 hosts
- Logs: 5-10GB per day per 100 hosts
- Traces: 2-4GB per day per million requests Consider implementing sampling strategies for cost-effective storage management.
- Can I implement o11y incrementally? Yes, incremental implementation is recommended. Start with basic metrics collection, add structured logging, then implement distributed tracing. This phased approach allows teams to build expertise and demonstrate value progressively.
- How do I choose between open-source and commercial o11y solutions? Consider these factors:
- Budget constraints
- In-house expertise
- Scale requirements
- Support needs OpenTelemetry with Uptrace offers a cost-effective starting point, while enterprise solutions provide comprehensive features with higher costs.
- What's the impact on application performance? Modern o11y implementation typically adds minimal overhead:
- Metrics: <1% CPU overhead
- Logging: 2-5% performance impact
- Tracing: 3-7% latency increase Proper sampling and configuration can further reduce these impacts.
- How do I handle sensitive data in o11y systems? Implement data protection through:
- PII detection and masking
- Field-level encryption
- Role-based access control
- Data retention policies Follow compliance requirements specific to your industry.
- What skills does my team need for o11y implementation? Key skills include:
- Distributed systems understanding
- Basic instrumentation knowledge
- Query and analysis capabilities
- Debugging methodology Training typically takes 2-4 weeks for basic proficiency.
- How do I measure o11y ROI? Track these key metrics:
- Reduction in MTTR (typically 40-60%)
- Decrease in incident frequency (30-50%)
- Team efficiency improvements (25-45%)
- Customer satisfaction increase (20-40%)
- Can o11y replace all other monitoring tools? While o11y provides comprehensive insights, some specialized tools might still be needed for:
- Network monitoring
- Security analysis
- Compliance reporting Consider o11y as part of a broader monitoring strategy.
- What's the best way to start with OpenTelemetry? Begin with:
- Auto-instrumentation of key services
- Basic metrics collection
- Structured logging implementation
- Gradual addition of custom instrumentation
- How do I manage o11y costs as I scale? Control costs through:
- Intelligent sampling strategies
- Data retention policies
- Resource optimization
- Tool consolidation Start with essential data collection and expand based on value.
Conclusion
O11y has become essential for modern software systems. Start small, focus on value, and scale gradually. Consider tools like Uptrace that provide comprehensive features while maintaining simplicity and cost-effectiveness.
You may also be interested in: