Logs and Errors
Uptrace collects logs and exceptions alongside traces, correlating them with spans automatically. The Logs & Errors section provides grouped and raw views of log records with filtering, search, and per-entry detail.
Groups view
By default, similar logs are grouped automatically by their _group_id. The Groups view shows each unique log pattern as a row with its frequency and last occurrence.
Default aggregations are perMin(count()) and max(_time). Sparklines on the right show how group frequency changes over time.
Logs tab
The Logs tab shows individual log records in chronological order with a volume histogram at the top.
Filters
Logs are filterable by any indexed attribute — service_name, log_severity, host_name, deployment_environment, and any custom attributes recorded on the log entry. Filters support equality, exclusion, regex, and range expressions. The Show Filters panel lists all available attributes with their values for quick selection.
Search
The search field supports full-text search across group-by columns with AND/OR logic, exclusion prefixes, and attribute-scoped queries (_kind:client, -key:value). Matching terms are highlighted inline.
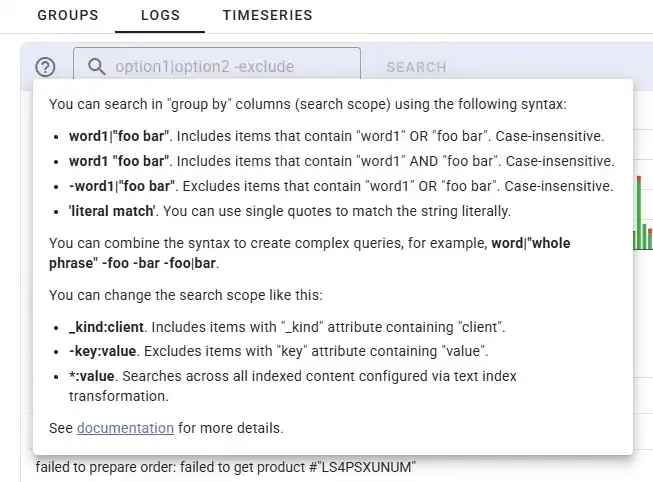
See Searching for the full syntax reference.
Log entry detail panel
The detail panel has six tabs: ATTRS, GROUP, JSON, TRACES, CONTEXT, TAGS.
ATTRS — all key-value attributes recorded on the log entry, with type annotations (::str, ::int, ::bool). Attributes are grouped by category: code, service, telemetry, other. A filter field narrows the list by key name.
GROUP — group ID, rate per minute, key attribute values (log_severity, telemetry_sdk_language), and a bar chart showing event frequency over time.
JSON — full internal record including span metadata (id, parentId, traceId, groupId, type, system) and the complete attrs object.
TRACES — span groups that co-occurred in the same traces as this log entry, with configurable metric columns and an Explore Traces button.
CONTEXT — neighboring log entries from the same trace context.
TAGS — tags associated with the log entry.
Timeseries view
The Timeseries tab shows log group frequency over time as a line chart. Individual groups can be toggled to isolate patterns.
Error monitors automatically fire alerts when logs reach ERROR or FATAL severity, or match a specific message pattern or exception type.