Monitoring errors and exceptions with OpenTelemetry
Introduction
Exception tracking with OpenTelemetry captures errors as they occur in your application and links them to the distributed trace context. This provides:
- Full stack traces attached to the span where the error occurred.
- Trace correlation linking exceptions to the request flow across services.
- Automatic grouping of similar exceptions in the Uptrace UI.
- Error aggregation showing frequency, affected users, and trends.
Recording exceptions
To record errors and exceptions with OpenTelemetry:
- Get the active span from the current context.
- Call
recordException(or equivalent) to capture the error. - Set the span status to
ERRORwith a descriptive message.
When you record an exception, OpenTelemetry automatically captures these semantic attributes:
| Attribute | Description |
|---|---|
exception.type | The exception class name |
exception.message | The error message |
exception.stacktrace | Full stack trace |
import (
    "go.opentelemetry.io/otel/codes"
    "go.opentelemetry.io/otel/trace"
)

func doWork(ctx context.Context) error {
    // Get the active span from the context.
    span := trace.SpanFromContext(ctx)

    if err := riskyOperation(); err != nil {
        // Record the error as an exception event.
        span.RecordError(err)
        // Mark the span as failed.
        span.SetStatus(codes.Error, err.Error())
        return err
    }
    return nil
}
For language-specific details, see the tracing documentation for your programming language:
Grouping exceptions together
By default, Uptrace groups exceptions by their type and message. To customize grouping, set the grouping.fingerprint attribute to a string or number that identifies similar exceptions:
exception.type = "RuntimeError"
exception.message = "operation failed: 123 456 789"
grouping.fingerprint = "operation failed"
This groups all "operation failed" exceptions together, ignoring the variable parts (123 456 789) in the message. You can also customize grouping rules in the Uptrace UI.
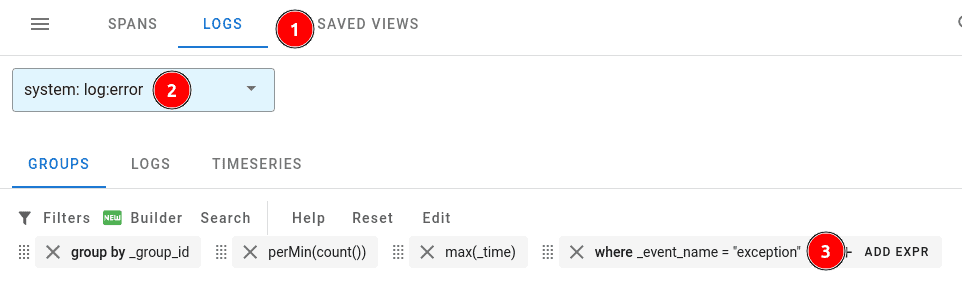
Viewing exceptions
Exceptions appear alongside ERROR logs in Uptrace. To view them:
- Navigate to Traces & Logs in the Uptrace UI.
- Click the Logs button.
- Select the log:error system.
- Filter with
where _event_name = "exception"orwhere exception_type exists.
Monitoring errors
Once exceptions flow into Uptrace, you can set up monitors to get notified when errors spike or new error types appear. To create a monitor, navigate to Alerting → Monitors and click New monitor → From YAML.
Error monitors
Error monitors trigger alerts for specific exceptions and logs. For example, you can create a monitor that watches for all recorded exceptions:
error_monitors:
  - name: Exceptions
    notify_everyone_by_email: true
    query:
      - group by _group_id
      - where _system in ("log:error", "log:fatal")
      - where exception_type exists
You can also filter by exception type or message:
error_monitors:
  - name: Payment errors
    notify_everyone_by_email: true
    query:
      - group by _group_id
      - where _system in ("log:error", "log:fatal")
      - where _display_name contains "PaymentError"
Metric monitors
You can use metric monitors to alert on error rates. For example, trigger an alert when the number of errors exceeds 10 per minute:
metric_monitors:
  - name: High error rate
    metrics:
      - uptrace_tracing_logs as $logs
    query:
      - perMin(sum($logs))
      - where _system in ("log:error", "log:fatal")
    detector:
      type: manual
      max_value: 10
    num_eval_points: 3
For the full list of monitor options and notification channels (Slack, PagerDuty, email, webhooks), see Alerts and Notifications.