OpenTelemetry Erlang/Elixir for Uptrace

This document explains how to configure the OpenTelemetry Erlang/Elixir SDK to export spans (traces) and metrics to Uptrace using OTLP/gRPC.
Quick Start Guide
Follow these steps to get your first trace running in 5 minutes:
Step 1: Create an Uptrace Project
Create an Uptrace project to obtain a DSN (Data Source Name), for example, https://<secret>@api.uptrace.dev?grpc=4317.
Step 2: Install dependencies
Add the necessary OpenTelemetry packages to your project dependencies:
# mix.exs
defp deps do
  [
    {:opentelemetry, "~> 1.3"},
    {:opentelemetry_api, "~> 1.2"},
    {:opentelemetry_exporter, "~> 1.6"}
  ]
end
Run the appropriate command to install dependencies:
# For Elixir projects
mix deps.get

# For Erlang projects
rebar3 compile
Step 3: Basic Configuration
Configure the OpenTelemetry SDK to export traces to Uptrace. Replace <YOUR_UPTRACE_DSN> with your actual Uptrace DSN from the project settings.
# config/config.exs or config/runtime.exs
config :opentelemetry,
  span_processor: :batch,
  traces_exporter: :otlp

config :opentelemetry_exporter,
  otlp_protocol: :grpc,
  otlp_compression: :gzip,
  otlp_endpoint: "https://api.uptrace.dev:4317",
  otlp_headers: [{"uptrace-dsn", "<YOUR_UPTRACE_DSN>"}]
Step 4: Create Your First Trace
Create a simple example to verify the setup:
# lib/my_app/example.ex
defmodule MyApp.Example do
  require OpenTelemetry.Tracer

  def main do
    # Create a tracer
    OpenTelemetry.Tracer.with_span "main-operation" do
      OpenTelemetry.Tracer.set_attribute("user.id", "12345")

      # Create a child span
      OpenTelemetry.Tracer.with_span "child-operation" do
        OpenTelemetry.Tracer.set_attributes(%{
          "http.method" => "GET",
          "http.url" => "http://localhost:8080/api/users"
        })

        # Simulate some work
        :timer.sleep(100)
      end
    end

    IO.puts("Trace sent to Uptrace!")
  end
end
Step 5: Run Your Application
Run the code with your Uptrace DSN set:
# For Elixir
UPTRACE_DSN="<FIXME>" mix run -e "MyApp.Example.main()"

# For Erlang
UPTRACE_DSN="<FIXME>" rebar3 shell -s my_app_example main
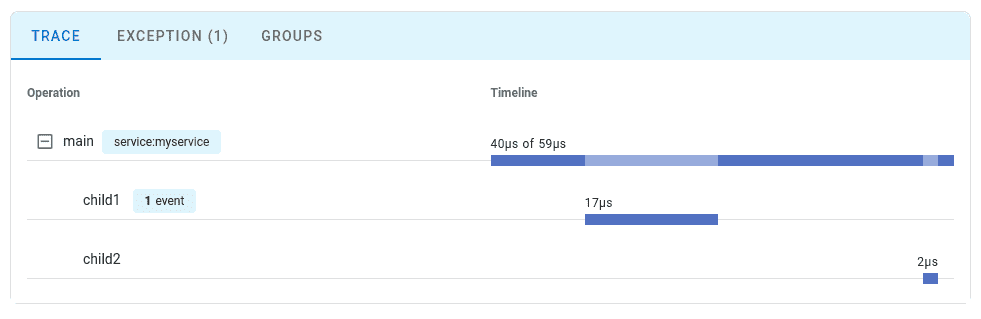
Step 6: View Your Trace
Open the Uptrace dashboard to view your trace. You should see the main-operation span with the child-operation nested inside it.
Environment Variables
You can also configure OpenTelemetry using environment variables, which is useful for containerized deployments:
export OTEL_EXPORTER_OTLP_ENDPOINT="https://api.uptrace.dev:4317"
export OTEL_EXPORTER_OTLP_PROTOCOL="grpc"
export OTEL_EXPORTER_OTLP_COMPRESSION="gzip"
export OTEL_EXPORTER_OTLP_HEADERS="uptrace-dsn=<YOUR_UPTRACE_DSN>"
For more configuration options, see the OTLP Exporter Configuration guide.
Configuration Options
The following configuration options are available for the OpenTelemetry Erlang/Elixir SDK:
| Option | Description |
|---|---|
span_processor | Span processor type: :batch (recommended) or :simple |
traces_exporter | Traces exporter: :otlp for OTLP, {:otel_exporter_stdout, []} for stdout |
otlp_protocol | OTLP protocol: :grpc (recommended) or :http_protobuf |
otlp_endpoint | OTLP endpoint URL. For Uptrace: https://api.uptrace.dev:4317 (gRPC) or https://api.uptrace.dev (HTTP) |
otlp_compression | Compression: :gzip (recommended) or :none |
otlp_headers | List of headers to include with each request. Include {"uptrace-dsn", "<YOUR_DSN>"} |
resource | Map of resource attributes like service.name and deployment.environment |
sampler | Sampling configuration to control trace collection rate |
resource_detectors | List of resource detectors to automatically detect environment info |
Application Configuration
Configure OpenTelemetry to start as a temporary application to prevent crashes from affecting your main application:
# mix.exs
def project do
  [
    app: :my_app,
    # ... other config
    releases: [
      my_app: [
        applications: [opentelemetry: :temporary]
      ]
    ]
  ]
end
This ensures that if OpenTelemetry terminates, your main application continues running.
Phoenix Framework Integration
To instrument Phoenix applications, add the Phoenix instrumentation library:
# mix.exs
defp deps do
  [
    # ... existing deps
    {:opentelemetry_phoenix, "~> 1.1"},
    {:opentelemetry_cowboy, "~> 0.2"},
    {:opentelemetry_ecto, "~> 1.2"}  # For database instrumentation
  ]
end
Configure Phoenix instrumentation in your application start function:
# lib/my_app/application.ex
def start(_type, _args) do
  # Setup instrumentation before starting supervision tree
  :opentelemetry_cowboy.setup()
  OpentelemetryPhoenix.setup(adapter: :cowboy2)
  OpentelemetryEcto.setup([:my_app, :repo])

  children = [
    MyApp.Repo,
    {Phoenix.PubSub, name: MyApp.PubSub},
    MyAppWeb.Endpoint
  ]

  opts = [strategy: :one_for_one, name: MyApp.Supervisor]
  Supervisor.start_link(children, opts)
end
This provides automatic instrumentation for HTTP requests, database queries, and Phoenix channels.
Troubleshooting
If traces don't appear in Uptrace:
- Verify DSN: Double-check your Uptrace DSN in the configuration
- Check connectivity: Ensure your application can reach
https://api.uptrace.dev:4317 - Review logs: Look for OpenTelemetry error messages in your application logs
- Test configuration: Use the stdout exporter for local testing:
# config/dev.exs
config :opentelemetry,
  traces_exporter: {:otel_exporter_stdout, []}
What's Next?
Instrument more operations to get a detailed picture of your application. Prioritize network calls, database queries, errors, and logs.
By Use Case
| I want to... | Read this |
|---|---|
| Configure OTLP exporter | OTLP Exporter |
| Instrument my code with spans | Tracing API |
| Collect application metrics | Metrics API |
| Send logs to Uptrace | Logs integration |
| Auto-detect cloud environment | Resource detectors |
| Enable distributed tracing | Context propagation |
| Reduce costs in production | Sampling strategies |