OpenTelemetry Rust distro for Uptrace
Uptrace is an open-source, OpenTelemetry-native APM platform. This document explains how to configure the OpenTelemetry Rust SDK to export spans (traces), logs, and metrics to Uptrace using OTLP/gRPC.
Quick Start Guide
Follow these steps to get your first trace running in 5 minutes:
Step 1: Create an Uptrace Project
Create an Uptrace project (or self-host Uptrace) to obtain a DSN (Data Source Name), for example, https://<secret>@api.uptrace.dev?grpc=4317.
Step 2: Add Dependencies
Add the required dependencies to your Cargo.toml:
[dependencies]
tokio = { version = "1", features = ["full"] }
tonic = { version = "0.13.1", features = ["tls-native-roots", "gzip"] }
opentelemetry = "0.30.0"
opentelemetry_sdk = { version = "0.30.0", features = ["rt-tokio"] }
opentelemetry-otlp = { version = "0.30.0", features = ["grpc-tonic", "gzip-tonic", "tls-roots", "trace"] }
opentelemetry-resource-detectors = "0.9"
Step 3: Basic Configuration
Configure the OTLP exporter with your Uptrace DSN:
use std::time::Duration;
use tonic::metadata::MetadataMap;
use opentelemetry::{global, KeyValue};
use opentelemetry::trace::Tracer;
use opentelemetry_otlp::{WithExportConfig, WithTonicConfig};
use opentelemetry_sdk::{
    propagation::TraceContextPropagator,
    trace::{BatchSpanProcessor, SdkTracerProvider},
    Resource,
};

fn init_tracer(dsn: String) -> Result<SdkTracerProvider, Box<dyn std::error::Error + Send + Sync>> {
    // Configure gRPC metadata with Uptrace DSN
    let mut metadata = MetadataMap::with_capacity(1);
    metadata.insert("uptrace-dsn", dsn.parse().unwrap());

    // Create OTLP span exporter
    let exporter = opentelemetry_otlp::SpanExporter::builder()
        .with_tonic()
        .with_tls_config(tonic::transport::ClientTlsConfig::new().with_native_roots())
        .with_endpoint("https://api.uptrace.dev:4317")
        .with_metadata(metadata)
        .with_timeout(Duration::from_secs(10))
        .build()?;

    // Build the tracer provider
    let provider = SdkTracerProvider::builder()
        .with_batch_exporter(exporter)
        .with_resource(
            Resource::builder()
                .with_attributes(vec![
                    KeyValue::new("service.name", "myservice"),
                    KeyValue::new("service.version", "1.0.0"),
                ])
                .build(),
        )
        .build();

    Ok(provider)
}
Step 4: Create Your First Trace
use opentelemetry::trace::{TraceContextExt, Tracer};
use opentelemetry::{global, KeyValue};

#[tokio::main]
async fn main() -> Result<(), Box<dyn std::error::Error + Send + Sync + 'static>> {
    // Read Uptrace DSN from environment
    let dsn = std::env::var("UPTRACE_DSN").expect("UPTRACE_DSN not found");

    // Initialize tracer
    let provider = init_tracer(dsn)?;
    global::set_tracer_provider(provider.clone());

    let tracer = global::tracer("myservice");

    // Create a root span
    tracer.in_span("main-operation", |cx| {
        let span = cx.span();
        span.set_attribute(KeyValue::new("operation.type", "example"));

        // Create a child span
        tracer.in_span("child-operation", |cx| {
            let span = cx.span();
            span.set_attribute(KeyValue::new("http.method", "GET"));
            span.set_attribute(KeyValue::new("http.url", "http://localhost:8080/api"));
        });

        println!(
            "View trace: https://app.uptrace.dev/traces/{}",
            span.span_context().trace_id()
        );
    });

    // Flush and shutdown
    provider.force_flush()?;
    provider.shutdown()?;

    Ok(())
}
Step 5: Run Your Application
Run the code, replacing <FIXME> with your Uptrace DSN:
$ UPTRACE_DSN="<FIXME>" cargo run
View trace: https://app.uptrace.dev/traces/<trace_id>
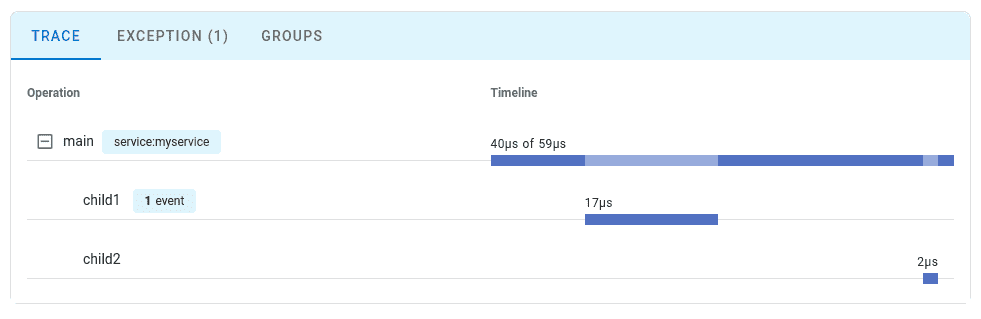
Step 6: View Your Trace
Follow the link to view the trace:
Configuration Options
Configure OpenTelemetry using environment variables or programmatically:
| Environment Variable | Description |
|---|---|
UPTRACE_DSN | Uptrace DSN for authentication |
OTEL_SERVICE_NAME | Service name (e.g., myservice) |
OTEL_RESOURCE_ATTRIBUTES | Additional resource attributes |
OTEL_TRACES_SAMPLER | Sampling strategy (e.g., parentbased_traceidratio) |
OTEL_TRACES_SAMPLER_ARG | Sampling argument (e.g., 0.1 for 10%) |
Uptrace fully supports the OpenTelemetry Protocol (OTLP) over both gRPC and HTTP transports.
If you already have an OTLP exporter configured, you can continue using it with Uptrace by simply pointing it to the Uptrace OTLP endpoint.
Connecting to Uptrace
Choose an OTLP endpoint from the table below and pass your DSN via the uptrace-dsn header for authentication:
| Transport | Endpoint | Port |
|---|---|---|
| gRPC | https://api.uptrace.dev:4317 | 4317 |
| HTTP | https://api.uptrace.dev | 443 |
When using HTTP transport, you often need to specify the full URL for each signal type:
https://api.uptrace.dev/v1/traceshttps://api.uptrace.dev/v1/logshttps://api.uptrace.dev/v1/metrics
Note: Most OpenTelemetry SDKs support both transports. Use HTTP unless you're already familiar with gRPC.
Recommended Settings
For performance and reliability, we recommend:
- Use
BatchSpanProcessorandBatchLogProcessorfor batching spans and logs, reducing the number of export requests. - Enable
gzipcompression to reduce bandwidth usage. - Prefer
deltametrics temporality (Uptrace converts cumulative metrics automatically). - Use Protobuf encoding instead of JSON (Protobuf is more efficient and widely supported).
- Use HTTP transport for simplicity and fewer configuration issues (unless you're already familiar with gRPC).
- Optionally, use the AWS X-Ray ID generator to produce trace IDs compatible with AWS X-Ray.
Common Environment Variables
You can use environment variables to configure resource attributes and propagators::
| Variable | Description |
|---|---|
OTEL_RESOURCE_ATTRIBUTES | Comma-separated resource attributes, e.g., service.name=myservice,service.version=1.0.0. |
OTEL_SERVICE_NAME=myservice | Sets the service.name attribute (overrides OTEL_RESOURCE_ATTRIBUTES). |
OTEL_PROPAGATORS | Comma-separated list of context propagators (default: tracecontext,baggage). |
Most language SDKs allow configuring the OTLP exporter entirely via environment variables:
# Endpoint (choose HTTP or gRPC)
export OTEL_EXPORTER_OTLP_ENDPOINT="https://api.uptrace.dev"         # HTTP
#export OTEL_EXPORTER_OTLP_ENDPOINT="https://api.uptrace.dev:4317"   # gRPC

# Pass DSN for authentication
export OTEL_EXPORTER_OTLP_HEADERS="uptrace-dsn=<FIXME>"

# Performance optimizations
export OTEL_EXPORTER_OTLP_COMPRESSION=gzip
export OTEL_EXPORTER_OTLP_METRICS_DEFAULT_HISTOGRAM_AGGREGATION=BASE2_EXPONENTIAL_BUCKET_HISTOGRAM
export OTEL_EXPORTER_OTLP_METRICS_TEMPORALITY_PREFERENCE=DELTA
Configure BatchSpanProcessor to balance throughput and payload size:
export OTEL_BSP_EXPORT_TIMEOUT=10000         # Max export timeout (ms)
export OTEL_BSP_MAX_EXPORT_BATCH_SIZE=10000  # Avoid >32MB payloads
export OTEL_BSP_MAX_QUEUE_SIZE=30000         # Adjust for available memory
export OTEL_BSP_MAX_CONCURRENT_EXPORTS=2     # Parallel exports
What's Next?
Instrument more operations to get a detailed picture of your application. Prioritize network calls, database queries, errors, and logs.
By Use Case
| I want to... | Read this |
|---|---|
| Configure OTLP exporter directly | OTLP Configuration |
| Instrument my code with spans | Tracing API |
| Collect application metrics | Metrics API |
| Send logs to Uptrace | Logs integration |
| Enable distributed tracing | Context propagation |
| Reduce costs in production | Sampling strategies |
| Auto-detect cloud environment | Resource detectors |
Framework Guides
OpenTelemetry Rust integrates with popular frameworks through the tracing ecosystem:
| Framework | Integration |
|---|---|
| Axum | Built-in tracing support |
| Actix-web | tracing-actix-web crate |
| Warp | Built-in tracing support |
| Hyper | Built-in tracing support |
| Reqwest | tracing-opentelemetry crate |
| SQLx | Built-in tracing support |
| Tokio | tokio-tracing features |
See the OTLP Configuration page for Axum and Actix-web integration examples.