OpenTelemetry Go distro for Uptrace
Uptrace is an open-source, OpenTelemetry-native APM platform. This document explains how to configure the OpenTelemetry Go SDK to export spans (traces), logs, and metrics to Uptrace using OTLP/gRPC.
Choose Your Setup Path
Option A: Quick Start with uptrace-go
Best for: Getting started quickly, automatic configuration
uptrace-go is a thin wrapper over opentelemetry-go that configures the OpenTelemetry SDK to export data to Uptrace. It does not add any new functionality and is provided only for your convenience.
Option B: Direct OTLP Configuration
Best for: Existing OpenTelemetry users, custom exporters, fine-grained control
Quick Start Guide
Follow these steps to get your first trace running in 5 minutes:
Step 1: Create an Uptrace Project
Create an Uptrace project (or self-host Uptrace) to obtain a DSN (Data Source Name), for example, https://<secret>@api.uptrace.dev?grpc=4317.
Step 2: Install uptrace-go
go get github.com/uptrace/uptrace-go
Step 3: Basic Configuration
You can configure the Uptrace client using a DSN (Data Source Name) from the project settings page. Replace <FIXME> with your actual Uptrace DSN, and myservice with a name that identifies your application.
import "github.com/uptrace/uptrace-go/uptrace"

uptrace.ConfigureOpentelemetry(
    // copy your project DSN here or use UPTRACE_DSN env var
    //uptrace.WithDSN("<FIXME>"),

    uptrace.WithServiceName("myservice"),
    uptrace.WithServiceVersion("v1.0.0"),
    uptrace.WithDeploymentEnvironment("production"),
)
Step 4: Create Your First Trace
Copy the code to main.go:
package main

import (
    "context"
    "errors"
    "fmt"

    "go.opentelemetry.io/otel"
    "go.opentelemetry.io/otel/attribute"
    "go.opentelemetry.io/otel/codes"
    "go.opentelemetry.io/otel/trace"

    "github.com/uptrace/uptrace-go/uptrace"
)

func main() {
    ctx := context.Background()

    // Configure OpenTelemetry with sensible defaults.
    uptrace.ConfigureOpentelemetry(
        // copy your project DSN here or use UPTRACE_DSN env var
        // uptrace.WithDSN("<FIXME>"),

        uptrace.WithServiceName("myservice"),
        uptrace.WithServiceVersion("1.0.0"),
    )
    // Send buffered spans and free resources.
    defer uptrace.Shutdown(ctx)

    // Create a tracer. Usually, tracer is a global variable.
    tracer := otel.Tracer("app_or_package_name")

    // Create a root span (a trace) to measure some operation.
    ctx, main := tracer.Start(ctx, "main-operation")
    // End the span when the operation we are measuring is done.
    defer main.End()

    // The passed ctx carries the parent span (main).
    // That is how OpenTelemetry manages span relations.
    _, child1 := tracer.Start(ctx, "GET /posts/:id")
    child1.SetAttributes(
        attribute.String("http.method", "GET"),
        attribute.String("http.route", "/posts/:id"),
        attribute.String("http.url", "http://localhost:8080/posts/123"),
        attribute.Int("http.status_code", 200),
    )
    if err := errors.New("dummy error"); err != nil {
        child1.RecordError(err, trace.WithStackTrace(true))
        child1.SetStatus(codes.Error, err.Error())
    }
    child1.End()

    _, child2 := tracer.Start(ctx, "SELECT")
    child2.SetAttributes(
        attribute.String("db.system", "mysql"),
        attribute.String("db.statement", "SELECT * FROM posts LIMIT 100"),
    )
    child2.End()

    fmt.Printf("trace: %s\n", uptrace.TraceURL(main))
}
Step 5: Run Your Application
Run the code, replacing <FIXME> with your Uptrace DSN:
$ UPTRACE_DSN="<FIXME>" go run main.go
trace: https://app.uptrace.dev/traces/<trace_id>
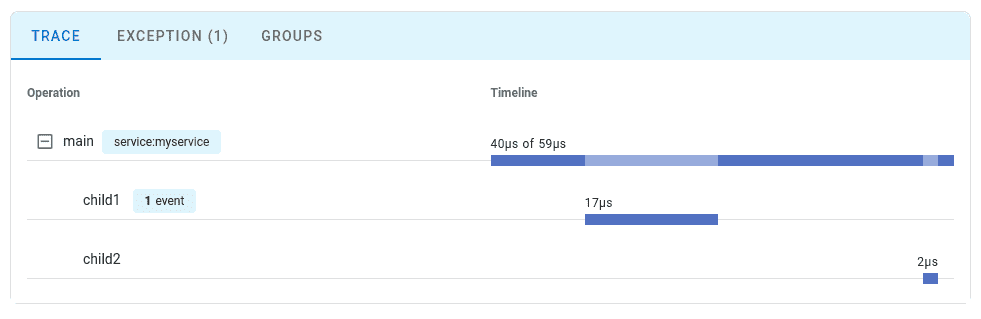
Step 6: View Your Trace
Follow the link to view the trace:
Configuration Options
You can find the full list of available options at pkg.go.dev.
| Option | Description |
|---|---|
WithDSN | A data source that specifies Uptrace project credentials. For example, https://<secret>@api.uptrace.dev?grpc=4317. |
WithServiceName | service.name resource attribute. For example, myservice. |
WithServiceVersion | service.version resource attribute. For example, 1.0.0. |
WithDeploymentEnvironment | deployment.environment resource attribute. For example, production. |
WithResourceAttributes | Any other resource attributes. |
WithResourceDetectors | Configures resource detectors for cloud environments (AWS, GCP). |
WithResource | Resource attributes representing an entity that produces telemetry. |
WithTraceSampler | Configures sampling to reduce costs in high-volume applications. |
Troubleshooting
Common Issues
No data in Uptrace:
- Verify the DSN is set correctly, either via
uptrace.WithDSN("...")or theUPTRACE_DSNenvironment variable - Check that the endpoint is reachable:
https://api.uptrace.dev:4317(gRPC) — if your network blocks gRPC, switch to the HTTP endpoint instead (see Direct OTLP Configuration) - Make sure you call
uptrace.Shutdown(ctx)(ortracerProvider.Shutdown(ctx)for direct OTLP) before the program exits — without it, buffered spans are dropped on shutdown - Confirm spans are actually being created: add a
fmt.Printlnaftertracer.Start()or check for exporter errors in stderr
Build/import errors:
- Run
go mod tidyafter addinggithub.com/uptrace/uptrace-goto pick up its OpenTelemetry SDK dependencies - Version mismatches between
go.opentelemetry.io/otelanduptrace-gousually mean a stalego.sum— re-rungo get -u github.com/uptrace/uptrace-go
High overhead in production:
- Reduce span volume with a sampler, for example
uptrace.WithTraceSampler(trace.TraceIDRatioBased(0.1))for 10% sampling - Batch exports are enabled by default; avoid calling
Shutdown/ForceFlushon a hot path
What's Next?
Instrument more operations to get a detailed picture of your application. Prioritize network calls, database queries, errors, and logs.
By Use Case
| I want to... | Read this |
|---|---|
| Instrument without code changes | Zero-code instrumentation |
| Instrument my code with spans | Tracing API |
| Collect application metrics | Metrics API |
| Send logs to Uptrace | Logs integration |
| Deploy to AWS Lambda or Vercel | Serverless |
| Enable distributed tracing | Context propagation |
| Reduce costs in production | Sampling strategies |
| Auto-detect cloud environment | Resource detectors |
Framework Guides
- OpenTelemetry net/http
- OpenTelemetry Go gRPC
- OpenTelemetry database/sql
- OpenTelemetry Gin
- OpenTelemetry GORM