OpenTelemetry Java for Uptrace
Uptrace is an open-source, OpenTelemetry-native APM platform. This document explains how to configure the OpenTelemetry Java Agent to export spans (traces), logs, and metrics to Uptrace using OTLP/gRPC.
OpenTelemetry Java Agent
The OpenTelemetry Java Agent provides automatic instrumentation and tracing capabilities for Java applications without requiring any code changes. It works by attaching to a Java application at runtime and intercepting method calls to collect telemetry data.
The agent supports a huge number of libraries and frameworks and most popular application servers.
Quick Start Guide
Follow these steps to get your first trace running in 5 minutes:
Step 1: Create an Uptrace Project
Create an Uptrace project (or self-host Uptrace) to obtain a DSN (Data Source Name), for example, https://<secret>@api.uptrace.dev?grpc=4317.
Step 2: Download Java Agent
Download the latest pre-compiled Java agent JAR:
wget https://github.com/open-telemetry/opentelemetry-java-instrumentation/releases/latest/download/opentelemetry-javaagent.jar
Step 3: Configure Environment Variables
Configure the agent to export data to Uptrace using environment variables. Replace <FIXME> with your actual Uptrace DSN, and myservice with a name that identifies your application:
export OTEL_RESOURCE_ATTRIBUTES=service.name=myservice,service.version=1.0.0
export OTEL_TRACES_EXPORTER=otlp
export OTEL_METRICS_EXPORTER=otlp
export OTEL_LOGS_EXPORTER=otlp
export OTEL_EXPORTER_OTLP_COMPRESSION=gzip
export OTEL_EXPORTER_OTLP_ENDPOINT=https://api.uptrace.dev:4317
export OTEL_EXPORTER_OTLP_HEADERS="uptrace-dsn=<FIXME>"
export OTEL_EXPORTER_OTLP_METRICS_TEMPORALITY_PREFERENCE=DELTA
export OTEL_EXPORTER_OTLP_METRICS_DEFAULT_HISTOGRAM_AGGREGATION=BASE2_EXPONENTIAL_BUCKET_HISTOGRAM
Step 4: Run Your Application
Enable the agent by providing the -javaagent flag when starting your application:
java -javaagent:path/to/opentelemetry-javaagent.jar \
     -jar myapp.jar
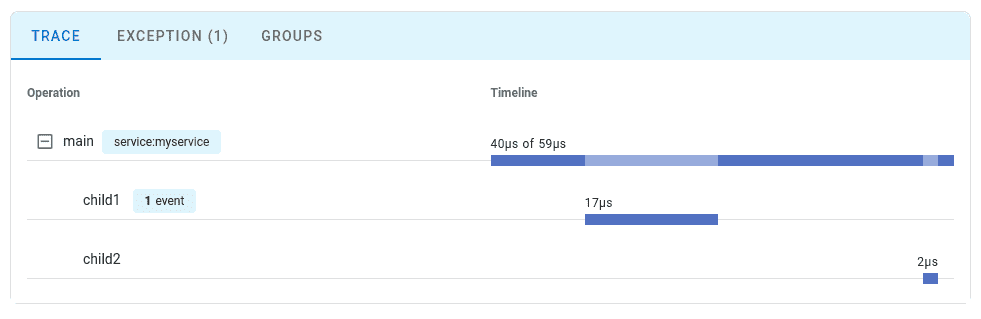
Step 5: View Your Trace
Navigate to the Uptrace UI to view your traces:
Configuration Options
You can find the full list of available options in the official documentation.
| Environment Variable | Description |
|---|---|
OTEL_SERVICE_NAME | The logical name of the service. For example, myservice. |
OTEL_RESOURCE_ATTRIBUTES | Key-value pairs to be used as resource attributes. For example, service.version=1.0.0. |
OTEL_EXPORTER_OTLP_ENDPOINT | OTLP exporter endpoint. For Uptrace, use https://api.uptrace.dev:4317. |
OTEL_EXPORTER_OTLP_HEADERS | Headers to send with OTLP requests. For example, uptrace-dsn=<your-dsn>. |
OTEL_TRACES_SAMPLER | Sampler to use. For example, parentbased_traceidratio. |
OTEL_TRACES_SAMPLER_ARG | Sampler argument. For example, 0.1 to sample 10% of traces. |
Configuration Methods
The agent can be configured using environment variables, system properties, or a configuration file.
export OTEL_EXPORTER_OTLP_PROTOCOL=grpc
export OTEL_EXPORTER_OTLP_ENDPOINT=https://api.uptrace.dev:4317
export OTEL_EXPORTER_OTLP_HEADERS="uptrace-dsn=<FIXME>"
export OTEL_RESOURCE_ATTRIBUTES=service.name=myservice,service.version=1.0.0
export OTEL_TRACES_EXPORTER=otlp
export OTEL_METRICS_EXPORTER=otlp
export OTEL_LOGS_EXPORTER=otlp
export OTEL_EXPORTER_OTLP_COMPRESSION=gzip
export OTEL_EXPORTER_OTLP_METRICS_TEMPORALITY_PREFERENCE=DELTA
export OTEL_EXPORTER_OTLP_METRICS_DEFAULT_HISTOGRAM_AGGREGATION=BASE2_EXPONENTIAL_BUCKET_HISTOGRAM
When using a configuration file, pass it to the agent using the otel.javaagent.configuration-file system property:
java -javaagent:path/to/opentelemetry-javaagent.jar \
     -Dotel.javaagent.configuration-file=path/to/uptrace.properties \
     -jar myapp.jar
Disabling the Java Agent
To disable the agent entirely, pass -Dotel.javaagent.enabled=false or use the OTEL_JAVAAGENT_ENABLED=false environment variable.
You can also disable specific instrumentations by passing -Dotel.instrumentation.[name].enabled=false or using the OTEL_INSTRUMENTATION_[NAME]_ENABLED=false environment variable. See the documentation for the list of instrumentation names.
Troubleshooting
Common Issues
Agent not starting:
- Verify the path to the
opentelemetry-javaagent.jarfile is correct - Check that Java has read permissions for the JAR file
- Ensure you're using a supported Java version
No data in Uptrace:
- Verify your DSN is correctly configured in
OTEL_EXPORTER_OTLP_HEADERS - Check that the endpoint URL is correct:
https://api.uptrace.dev:4317 - Ensure your application is generating spans (check application logs for errors)
Performance issues:
- Adjust sampling rate to reduce overhead:
OTEL_TRACES_SAMPLER_ARG=0.1(10% sampling) - Disable unused instrumentations to reduce memory usage
What's Next?
Instrument more operations to get a detailed picture of your application. Prioritize network calls, database queries, errors, and logs.
By Use Case
| I want to... | Read this |
|---|---|
| Instrument without code changes | Zero-code instrumentation |
| Instrument my code with spans | Tracing API |
| Collect application metrics | Metrics API |
| Send logs to Uptrace | Logs integration |
| Enable distributed tracing | Context propagation |
| Reduce costs in production | Sampling strategies |
| Auto-detect cloud environment | Resource detectors |