Monitor OpenTelemetry Node.js with Uptrace

This guide explains how to configure the OpenTelemetry JavaScript SDK for Node.js to export spans (traces), metrics, and logs using the OTLP/HTTP protocol. You'll learn how to quickly integrate OpenTelemetry into your Node.js applications for effective monitoring and observability with Uptrace.
To learn about the OpenTelemetry API in more detail, see OpenTelemetry JS Tracing API and OpenTelemetry JS Metrics API.
Prerequisites
Before you begin, ensure you have:
- A Node.js application running on Node.js 18+
- An Uptrace account with a valid DSN (Data Source Name)
- Basic familiarity with your application's architecture
Installation Options
Option 1: Using Uptrace Node.js Distribution (Recommended)
uptrace-js is a lightweight wrapper around opentelemetry-js that pre-configures the OpenTelemetry SDK to export data to Uptrace. It doesn't add new functionality but simplifies the setup process for your convenience.
Installation:
npm install @uptrace/node --save
Option 2: Direct OTLP Exporter
Use the OTLP exporter directly if you prefer more control over the configuration or are already using OpenTelemetry exporters. See Direct OTLP Configuration for details.
Quick Start Guide
Follow this 5-minute guide to install the OpenTelemetry distribution, generate your first trace, and view it in the Uptrace dashboard.
Step 1: Create Uptrace Project
Create an Uptrace project to obtain a DSN (connection string), for example: https://<secret>@api.uptrace.dev?grpc=4317.
Step 2: Install @uptrace/node
Install @uptrace/node:
npm install @uptrace/node --save
Step 3: Configure OpenTelemetry
Configure the Uptrace client using a DSN (Data Source Name) from your project settings page. Replace <FIXME> with your actual Uptrace DSN and myservice with a name that identifies your application.
You must call configureOpentelemetry as early as possible and before importing other packages, because the OpenTelemetry SDK must patch libraries before you import them.
// The very first import must be Uptrace and/or OpenTelemetry.
const uptrace = require('@uptrace/node')
const otel = require('@opentelemetry/api')

// Start OpenTelemetry SDK and invoke instrumentations to patch the code.
const sdk = uptrace.configureOpentelemetry({
  // Copy your project DSN here or use UPTRACE_DSN env var
  //dsn: '<FIXME>',
  serviceName: 'myservice',
  serviceVersion: '1.0.0',
  deploymentEnvironment: 'production',
})
sdk.start()

// Other imports. Express is monkey-patched by OpenTelemetry at this point.
const express = require('express')

// Create a tracer.
const tracer = otel.trace.getTracer('app_or_package_name')

// Start the app.
const app = express()
app.listen(3000)
You can use the following options to configure Uptrace client.
| Option | Description |
|---|---|
dsn | A data source that is used to connect to uptrace.dev. For example, https://<token>@uptrace.dev/<project_id>. |
serviceName | service.name resource attribute. For example, myservice. |
serviceVersion | service.version resource attribute. For example, 1.0.0. |
deploymentEnvironment | deployment.environment resource attribute. For example, production. |
resourceAttributes | Any other resource attributes. |
resource | Resource contains attributes representing an entity that produces telemetry. Resource attributes are copied to all spans and events. |
Step 4: Create Your First Trace
Copy the code to main.js:
'use strict'

// The very first import must be Uptrace/OpenTelemetry.
const otel = require('@opentelemetry/api')
const uptrace = require('@uptrace/node')

// Start OpenTelemetry SDK and invoke instrumentations to patch the code.
const sdk = uptrace.configureOpentelemetry({
  // Set dsn or UPTRACE_DSN env var.
  //dsn: '<FIXME>',
  serviceName: 'myservice',
  serviceVersion: '1.0.0',
})
sdk.start()

// Create a tracer. Usually, tracer is a global variable.
const tracer = otel.trace.getTracer('app_or_package_name', '1.0.0')

// Create a root span (a trace) to measure some operation.
tracer.startActiveSpan('main-operation', (main) => {
  tracer.startActiveSpan('GET /posts/:id', (child1) => {
    child1.setAttribute('http.method', 'GET')
    child1.setAttribute('http.route', '/posts/:id')
    child1.setAttribute('http.url', 'http://localhost:8080/posts/123')
    child1.setAttribute('http.status_code', 200)
    child1.recordException(new Error('error1'))
    child1.end()
  })

  tracer.startActiveSpan('SELECT', (child2) => {
    child2.setAttribute('db.system', 'mysql')
    child2.setAttribute('db.statement', 'SELECT * FROM posts LIMIT 100')
    child2.end()
  })

  // End the span when the operation we are measuring is done.
  main.end()

  console.log(sdk.traceUrl(main))
})

setTimeout(async () => {
  // Send buffered spans and free resources.
  await sdk.shutdown()
})
Step 5: Run Your Application
Execute the example, replacing <FIXME> with your Uptrace DSN:
$ UPTRACE_DSN="<FIXME>" node main.js
https://app.uptrace.dev/traces/<trace_id>
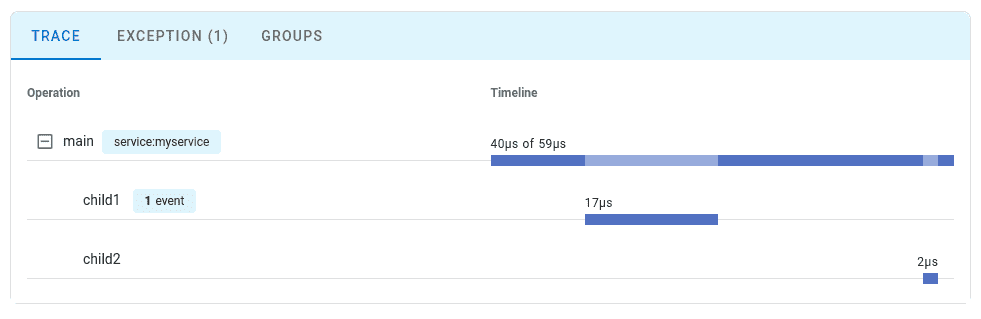
Step 6: View Your Trace
Click the generated link to view your trace in the Uptrace dashboard:
Best Practices
To avoid potential issues, it is strongly recommended to put the OpenTelemetry initialization code into a separate file called otel.js and use the --require flag to load the tracing code before the application code:
node --require ./otel.js app.js
If you are using AWS Lambda, you need to set the NODE_OPTIONS environment variable:
export NODE_OPTIONS="--require otel.js"
See express-pg for a working example.
Automatic Instrumentation
One of the key benefits of OpenTelemetry with Node.js is automatic instrumentation. Whenever you load a module, OpenTelemetry automatically checks if there's a matching instrumentation plugin and uses it to patch the original package.
Frameworks and Libraries
OpenTelemetry automatically instruments popular Node.js libraries including:
- HTTP/HTTPS: Built-in Node.js HTTP modules
- Express: Web application framework
- Fastify: Fast and efficient web framework
- Koa: Expressive middleware framework
- Database: PostgreSQL, MySQL, MongoDB, Redis
- gRPC: High-performance RPC framework
- GraphQL: Query language and runtime
Manual Instrumentation
You can also register instrumentations manually for more control:
const uptrace = require('@uptrace/node')
const { HttpInstrumentation } = require('@opentelemetry/instrumentation-http')
const { PgInstrumentation } = require('@opentelemetry/instrumentation-pg')

const sdk = uptrace.configureOpentelemetry({
  // Set dsn or UPTRACE_DSN env var.
  dsn: '<FIXME>',

  serviceName: 'myservice',
  serviceVersion: '1.0.0',

  instrumentations: [new PgInstrumentation(), new HttpInstrumentation()],
})
sdk.start()
Disabling Specific Instrumentations
You can disable specific automatic instrumentations if needed:
const { getNodeAutoInstrumentations } = require('@opentelemetry/auto-instrumentations-node')

const sdk = uptrace.configureOpentelemetry({
  dsn: '<FIXME>',
  serviceName: 'myservice',
  serviceVersion: '1.0.0',

  instrumentations: [
    getNodeAutoInstrumentations({
      '@opentelemetry/instrumentation-fs': {
        enabled: false,
      },
      '@opentelemetry/instrumentation-dns': {
        enabled: false,
      },
    }),
  ],
})
Runtime Metrics
To collect Node.js runtime metrics such as memory usage, event loop lag, and garbage collection statistics, install opentelemetry-node-metrics:
# npm
npm install opentelemetry-node-metrics --save

# yarn
yarn add opentelemetry-node-metrics --save
Then start collecting metrics:
const otel = require('@opentelemetry/api')
const uptrace = require('@uptrace/node')
const startNodeMetrics = require('opentelemetry-node-metrics')

const sdk = uptrace.configureOpentelemetry({...})
sdk.start()

// Must be called AFTER OpenTelemetry is configured.
const meterProvider = otel.metrics.getMeterProvider()
startNodeMetrics(meterProvider)
This will automatically collect metrics including:
- Memory Usage: Heap and external memory statistics
- Event Loop: Event loop lag and utilization
- Garbage Collection: GC duration and frequency
- CPU Usage: Process CPU utilization
- File Descriptors: Open file descriptor count
Environment Variables Configuration
You can configure OpenTelemetry using environment variables instead of code configuration:
# Service configuration
export OTEL_SERVICE_NAME="myservice"
export OTEL_SERVICE_VERSION="1.0.0"
export OTEL_RESOURCE_ATTRIBUTES="deployment.environment=production"

# OTLP Exporter configuration
export OTEL_EXPORTER_OTLP_ENDPOINT="https://api.uptrace.dev"
export OTEL_EXPORTER_OTLP_HEADERS="uptrace-dsn=<FIXME>"
export OTEL_EXPORTER_OTLP_COMPRESSION="gzip"

# Batch span processor configuration
export OTEL_BSP_EXPORT_TIMEOUT="10000"
export OTEL_BSP_MAX_EXPORT_BATCH_SIZE="1000"
export OTEL_BSP_MAX_QUEUE_SIZE="10000"

# Metrics configuration
export OTEL_EXPORTER_OTLP_METRICS_TEMPORALITY_PREFERENCE="DELTA"
export OTEL_METRIC_EXPORT_INTERVAL="15000"
Sampling Configuration
Configure sampling to control the volume of trace data:
const { TraceIdRatioBasedSampler } = require('@opentelemetry/sdk-trace-base')

const sdk = uptrace.configureOpentelemetry({
  dsn: '<FIXME>',
  serviceName: 'myservice',

  // Sample 10% of traces
  sampler: new TraceIdRatioBasedSampler(0.1),
})
Or use environment variables:
# Sample 50% of traces
export OTEL_TRACES_SAMPLER="traceidratio"
export OTEL_TRACES_SAMPLER_ARG="0.5"
Querying Data
Once your application is instrumented and sending data to Uptrace, you can query spans and logs using:
Span Search
- Service filtering: Filter traces by service name, operation name, and duration
- Attribute search: Search by custom attributes like
http.status_code,db.statement - Error filtering: Find traces containing errors or specific exception types
- Performance analysis: Identify slow operations and bottlenecks
Log Search
- Text search: Search logs by message content and severity level
- Trace correlation: Navigate from logs to related traces using trace IDs
- Structured logging: Query structured log attributes and metadata
- Time-based filtering: Filter logs by timestamp ranges
Advanced Querying
- SQL-like syntax: Use complex queries for data analysis and aggregation
- Custom dashboards: Create visualizations for your specific metrics
- Alerting: Set up alerts based on error rates, latency, or custom metrics
Verifying Your Setup
After configuration, your application will automatically start sending telemetry data to Uptrace. To verify the setup:
- Start your application with the new configuration
- Generate activity by making HTTP requests, database queries, or triggering your instrumented code paths
- Check the Uptrace dashboard for incoming traces within 1-2 minutes
- Review trace details to ensure spans are being created with proper attributes and timing
Troubleshooting
If OpenTelemetry is not working as expected, you can enable verbose logging to check for potential issues:
const { DiagConsoleLogger, DiagLogLevel, diag } = require('@opentelemetry/api')
diag.setLogger(new DiagConsoleLogger(), DiagLogLevel.DEBUG)
Common Issues
No data appearing in Uptrace:
- Verify your DSN is correctly configured in the environment or code
- Check that your application is generating spans/metrics through activity
- Ensure network connectivity to Uptrace endpoints (
https://api.uptrace.dev) - Confirm the OpenTelemetry initialization happens before other imports
Performance issues:
- Adjust sampling rates if collecting too much data
- Review instrumentation configuration for unnecessary overhead
- Use batch processors instead of simple processors for better performance
- Consider reducing export frequency for metrics
Import order issues:
- Ensure OpenTelemetry initialization happens before other imports
- Use the
--requireflag to load tracing code before application code - Check that instrumentations are patching libraries correctly
Memory usage concerns:
- Monitor span queue sizes and adjust
maxQueueSizeaccordingly - Implement proper sampling strategies for high-traffic applications
- Use resource detection to avoid redundant resource attributes
Network connectivity issues:
- Verify firewall rules allow outbound HTTPS traffic to
api.uptrace.dev - Check proxy configurations if running behind corporate firewalls
- Test endpoint connectivity using curl or similar tools
Best Practices
- Initialize Early: Always initialize OpenTelemetry before importing application modules
- Use Environment Variables: Prefer environment variables for configuration in production
- Implement Proper Sampling: Use appropriate sampling rates for your traffic volume
- Monitor Resource Usage: Keep an eye on memory and CPU overhead
- Handle Errors Gracefully: Ensure telemetry failures don't break your application
- Use Semantic Conventions: Follow OpenTelemetry semantic conventions for attributes
- Correlate Signals: Link traces, metrics, and logs using trace and span IDs
What's Next?
Next, instrument more operations to get a more detailed picture. Try to prioritize network calls, disk operations, database queries, errors, and logs.