Monitor FastAPI with OpenTelemetry

By integrating OpenTelemetry with FastAPI, you can gain valuable insight into the performance, behavior and dependencies of your API. You can monitor and troubleshoot issues, optimize performance, and ensure the reliability of your FastAPI applications.
What is FastAPI?
FastAPI is a modern, high-performance web framework for building APIs with Python. It is designed to be easy to use, highly efficient, and able to handle high loads.
FastAPI's combination of performance, productivity, and modern features has made it popular among developers building APIs with Python.
What is OpenTelemetry?
OpenTelemetry is an open source observability framework hosted by Cloud Native Computing Foundation. It is a merger of OpenCensus and OpenTracing projects.
OpenTelemetry aims to provide a single standard across all types of observability signals such as OpenTemetry logs, distributed tracing, and metrics.
OpenTelemetry specifies how to collect and send telemetry data to backend platforms. With OpenTelemetry, you can instrument your application once and then add or change vendors without changing the instrumentation.
OpenTelemetry provides detailed instrumentation, enabling you to monitor and measure the performance of your FastAPI applications in real-time. You can identify bottlenecks, optimize code, and ensure your application runs smoothly even under heavy traffic.
FastAPI instrumentation
To install OpenTelemetry instrumentation for FastAPI:
pip install opentelemetry-api opentelemetry-sdk opentelemetry-instrumentation-fastapi
OpenTelemetry SDK
To initialize OpenTelemetry in your Flask application, add the following to your application's startup code, for example, in your app.py or wsgi.py file:
from opentelemetry import trace
from opentelemetry.sdk.trace import TracerProvider
from opentelemetry.sdk.trace.export import (
    BatchSpanProcessor,
    ConsoleSpanExporter,
)

provider = TracerProvider()
processor = BatchSpanProcessor(ConsoleSpanExporter())
provider.add_span_processor(processor)

# Sets the global default tracer provider
trace.set_tracer_provider(provider)

# Creates a tracer from the global tracer provider
tracer = trace.get_tracer("my.tracer.name")
Usage
To instrument FastAPI application:
from fastapi import FastAPI
from opentelemetry.instrumentation.fastapi import FastAPIInstrumentor

app = FastAPI()
FastAPIInstrumentor.instrument_app(app)
Also see OpenTelemetry FastAPI example at GitHub.
OpenTelemetry allows you to trace requests as they flow through your FastAPI application, providing a clear picture of how different components and services interact. This end-to-end tracing helps diagnose issues quickly and streamline troubleshooting.
Once your FastAPI application is instrumented with OpenTelemetry, you can use the observability data in a variety of ways. You can visualize distributed traces, analyze performance metrics, and gain insight into the behavior of your API using OpenTelemetry backends such as Uptrace, Jaeger, Prometheus, or Grafana.
Instrumenting your code
OpenTelemetry can automatically trace incoming HTTP requests to your FastAPI application. You can also create custom spans to trace specific parts of your code. For example:
from opentelemetry import trace

tracer = trace.get_tracer(__name__)

@app.get("/")
async def read_root():
    # Create a custom span
    with tracer.start_as_current_span("custom-span"):
        # Your code here
        return {"message": "Hello, World!"}
What is Uptrace?
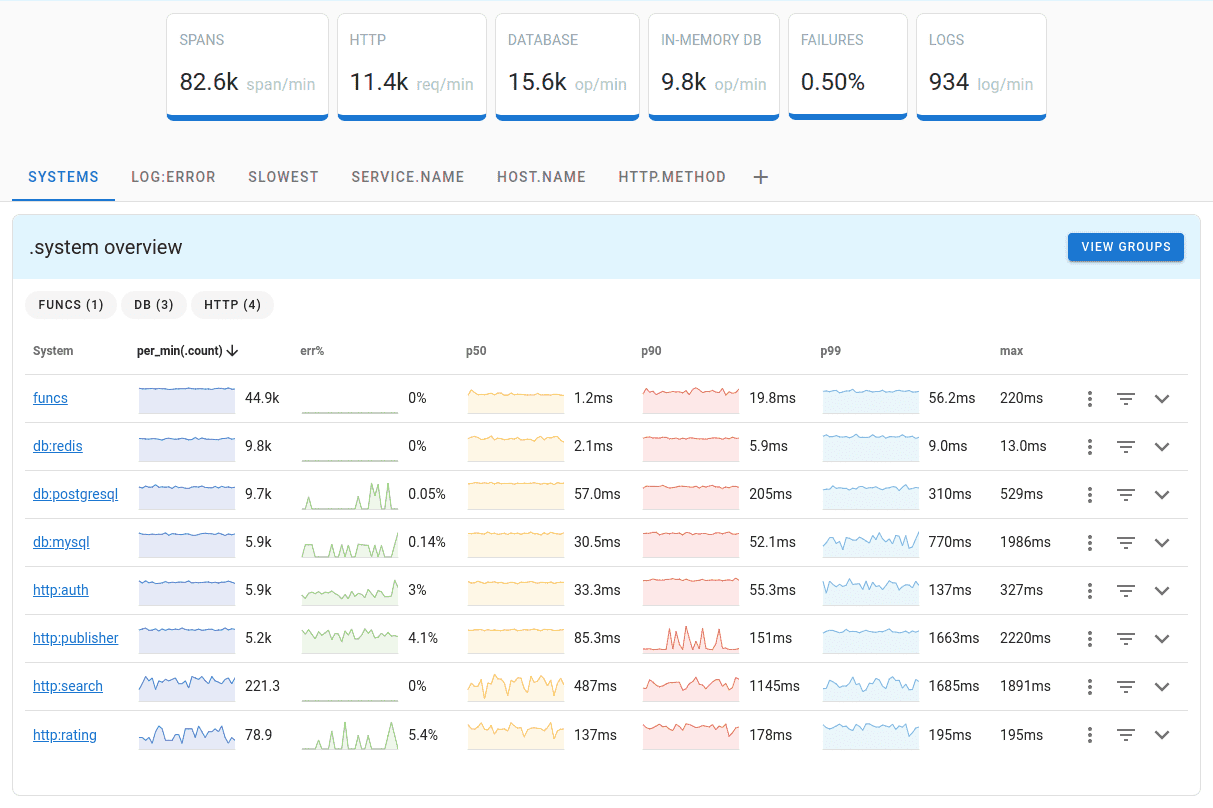
Uptrace is an open source APM for OpenTelemetry that supports distributed tracing, metrics, and logs. You can use it to monitor applications and troubleshoot issues.

Uptrace comes with an intuitive query builder, rich dashboards, alerting rules, notifications, and integrations for most languages and frameworks.
Uptrace can process billions of spans and metrics on a single server and allows you to monitor your applications at 10x lower cost.
In just a few minutes, you can try Uptrace by visiting the cloud demo (no login required) or running it locally with Docker. The source code is available on GitHub.
uvicorn
If you are using uvicorn with Gunicorn, you need to initialize OpenTelemetry in the post-fork hook:
import uptrace

def post_fork(server, worker):
    uptrace.configure_opentelemetry(...)

workers = 4
worker_class = "uvicorn.workers.UvicornWorker"
See Application servers for details.
Conclusion
With insights from OpenTelemetry, you can make informed decisions about scaling your FastAPI application. Load balancing strategies can be adjusted based on real-time data to handle traffic spikes effectively.
OpenTelemetry also allows you to instrument specific parts of your code for custom telemetry collection. You can use OpenTelemetry Python APIs to manually create spans and add custom attributes, events, or metrics to capture additional information.