Monitor SQLAlchemy performance with OpenTelemetry
SQLAlchemy is an Object Relational Mapper for Python that gives application developers the full power and flexibility of SQL.
In this article you will learn how to monitor and optimize SQLAlchemy performance using OpenTelemetry observability framework.
What is OpenTelemetry?
OpenTelemetry is an open-source observability framework that aims to standardize and simplify the collection, processing, and export of telemetry data from applications and systems.
OpenTelemetry supports multiple programming languages and platforms, making it suitable for a wide range of applications and environments.
OpenTelemetry enables developers to instrument their code and collect telemetry data, which can then be exported to various OpenTelemetry backends or observability platforms for analysis and visualization.
SQLAlchemy instrumentation
To install OpenTelemetry instrumentation for SQLAlchemy:
pip install opentelemetry-instrumentation-sqlalchemy
Usage
To instrument sqlalchemy database client:
from sqlalchemy import create_engine
from opentelemetry.instrumentation.sqlalchemy import SQLAlchemyInstrumentor

engine = create_engine("sqlite:///:memory:")
SQLAlchemyInstrumentor().instrument(engine=engine)
What is Uptrace?
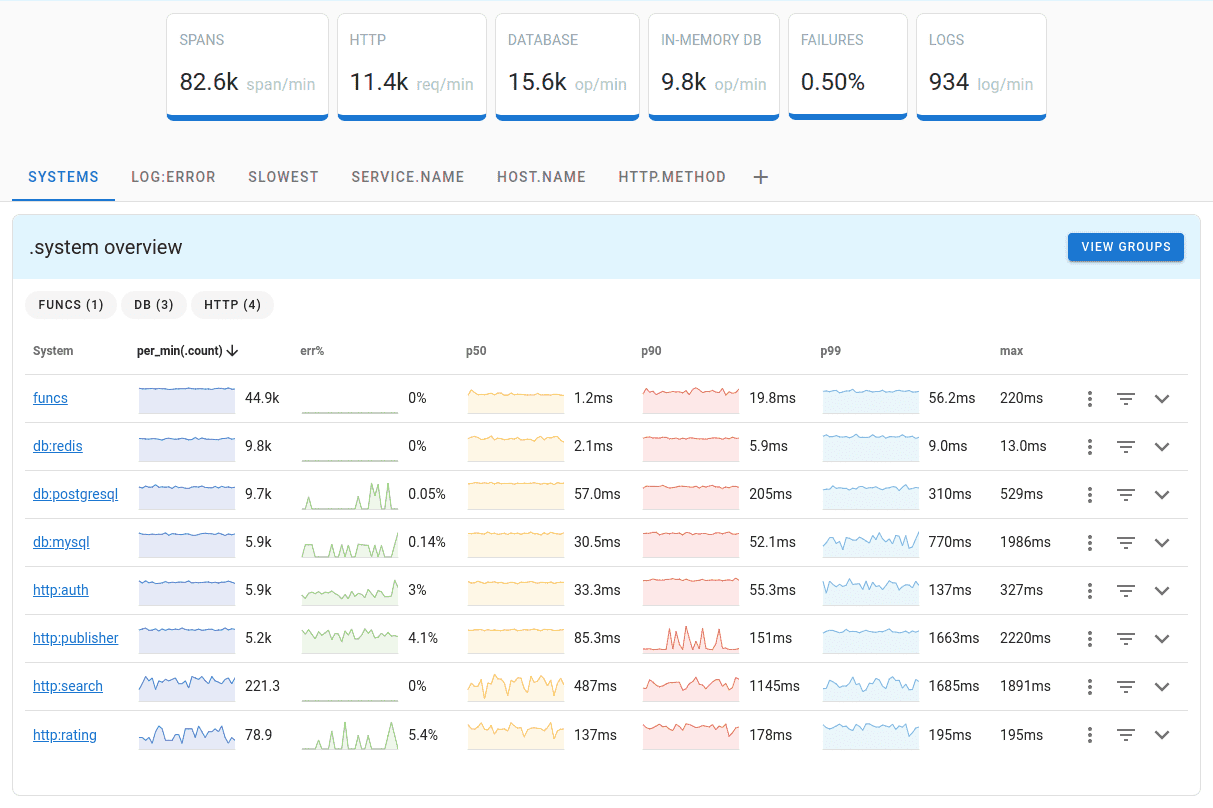
Uptrace is a OpenTelemetry APM that supports distributed tracing, metrics, and logs. You can use it to monitor applications and troubleshoot issues.

Uptrace comes with an intuitive query builder, rich dashboards, alerting rules with notifications, and integrations for most languages and frameworks.
Uptrace can process billions of spans and metrics on a single server and allows you to monitor your applications at 10x lower cost.
In just a few minutes, you can try Uptrace by visiting the cloud demo (no login required) or running it locally with Docker. The source code is available on GitHub.
What's next
Next, instrument more operations to get a more detailed picture. Try to prioritize network calls, disk operations, database queries, error and logs.
You can also create your own instrumentations using OpenTelemetry Python Tracing API.
Popular instrumentations: