OpenTelemetry Swift for Uptrace
Uptrace is an open-source, OpenTelemetry-native APM platform. This document explains how to configure the OpenTelemetry Swift SDK to export spans (traces) and metrics to Uptrace using OTLP/gRPC or OTLP/HTTP.
Overview
OpenTelemetry Swift is the official OpenTelemetry implementation for Swift. It supports iOS, macOS, tvOS, and watchOS applications, providing:
- Tracing - Distributed tracing with automatic context propagation
- Metrics - Application metrics (counters, histograms, gauges)
- NSURLSession instrumentation - Automatic HTTP request tracing
- Resource detection - Device, OS, and application metadata
Quick Start Guide
Follow these steps to get your first trace running:
Step 1: Create an Uptrace Project
Create an Uptrace project (or self-host Uptrace) to obtain a DSN (Data Source Name), for example, https://<secret>@api.uptrace.dev?grpc=4317.
Step 2: Add Dependencies
Add OpenTelemetry Swift to your Package.swift:
// swift-tools-version:5.9
import PackageDescription

let package = Package(
    name: "MyApp",
    platforms: [
        .macOS(.v13),
        .iOS(.v16)
    ],
    dependencies: [
        .package(url: "https://github.com/open-telemetry/opentelemetry-swift", from: "1.0.0"),
        .package(url: "https://github.com/grpc/grpc-swift.git", from: "1.0.0"),
    ],
    targets: [
        .executableTarget(
            name: "MyApp",
            dependencies: [
                .product(name: "OpenTelemetryApi", package: "opentelemetry-swift"),
                .product(name: "OpenTelemetrySdk", package: "opentelemetry-swift"),
                .product(name: "OpenTelemetryProtocolExporter", package: "opentelemetry-swift"),
                .product(name: "ResourceExtension", package: "opentelemetry-swift"),
                .product(name: "GRPC", package: "grpc-swift"),
            ]
        )
    ]
)
Step 3: Configure OpenTelemetry
Create a configuration file to initialize the SDK:
import Foundation
import GRPC
import NIO
import OpenTelemetryApi
import OpenTelemetrySdk
import OpenTelemetryProtocolExporter
import ResourceExtension

func configureOpenTelemetry(dsn: String) {
    // Parse DSN to extract endpoint and token
    // DSN format: https://<token>@api.uptrace.dev?grpc=4317

    let group = MultiThreadedEventLoopGroup(numberOfThreads: 1)
    let channel = ClientConnection
        .usingPlatformAppropriateTLS(for: group)
        .connect(host: "api.uptrace.dev", port: 4317)

    // Configure OTLP trace exporter with Uptrace DSN header
    let otlpConfig = OtlpConfiguration(
        timeout: OtlpConfiguration.DefaultTimeoutInterval,
        headers: [("uptrace-dsn", dsn)]
    )

    let traceExporter = OtlpTraceExporter(
        channel: channel,
        config: otlpConfig
    )

    // Use BatchSpanProcessor for production
    let spanProcessor = BatchSpanProcessor(spanExporter: traceExporter)

    // Configure resource attributes
    let resource = DefaultResources().get().merging(other: Resource(attributes: [
        ResourceAttributes.serviceName.rawValue: AttributeValue.string("myservice"),
        ResourceAttributes.serviceVersion.rawValue: AttributeValue.string("1.0.0"),
        ResourceAttributes.deploymentEnvironment.rawValue: AttributeValue.string("production")
    ]))

    // Register the tracer provider
    OpenTelemetry.registerTracerProvider(tracerProvider:
        TracerProviderBuilder()
            .add(spanProcessor: spanProcessor)
            .with(resource: resource)
            .build()
    )
}
Step 4: Create Your First Trace
import OpenTelemetryApi
import OpenTelemetrySdk

// Get the tracer
let tracer = OpenTelemetry.instance.tracerProvider.get(
    instrumentationName: "MyApp",
    instrumentationVersion: "1.0.0"
)

// Create a span
let span = tracer.spanBuilder(spanName: "my-operation")
    .setSpanKind(spanKind: .internal)
    .startSpan()

// Add attributes
span.setAttribute(key: "user.id", value: "12345")
span.setAttribute(key: "http.method", value: "GET")

// Do some work...

// End the span
span.end()
Step 5: Run Your Application
Set the DSN and run your application:
UPTRACE_DSN="https://<token>@api.uptrace.dev?grpc=4317" swift run
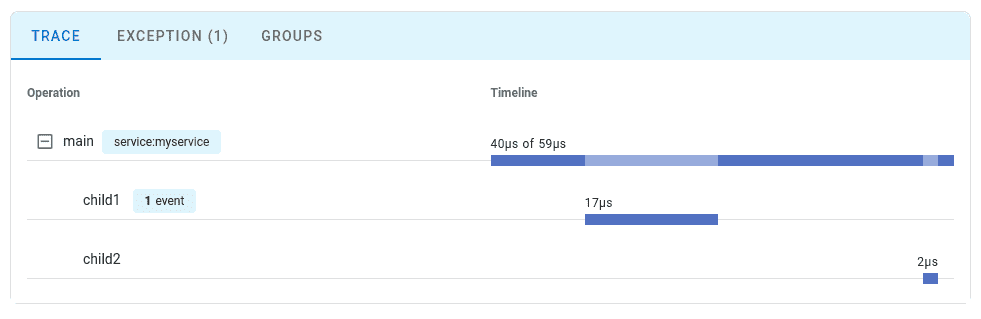
Step 6: View Your Trace
Open Uptrace and navigate to your project to see the traces:
Configuration Options
| Option | Description |
|---|---|
OtlpConfiguration.timeout | Export timeout interval. Default: 10 seconds. |
OtlpConfiguration.headers | HTTP headers for authentication. Set uptrace-dsn header. |
BatchSpanProcessor | Batches spans before export for better performance. |
SimpleSpanProcessor | Exports spans immediately. Use for debugging only. |
Resource | Attributes describing the service (name, version, environment). |
What's Next?
Instrument more operations to get a detailed picture of your application. Prioritize network calls, database queries, errors, and logs.
By Use Case
| I want to... | Read this |
|---|---|
| Configure OTLP exporter in detail | OTLP Configuration |
| Instrument my code with spans | Tracing API |
| Collect application metrics | Metrics API |
| Add resource attributes | Resource Attributes |
| Enable distributed tracing | Context Propagation |
| Reduce costs in production | Sampling Strategies |
Instrumentation Libraries
OpenTelemetry Swift provides built-in instrumentation for:
- NSURLSession - Automatic HTTP request tracing
- SignpostIntegration - Integration with Apple Instruments profiler
See Instrumentation Libraries for the full list.