Monitor Flask performance with OpenTelemetry
By integrating OpenTelemetry with Flask, you can gain valuable insight into the performance, behavior, and dependencies of your application.
Using OpenTelemetry, you can monitor and troubleshoot issues, optimize performance, and ensure the reliability of your Flask applications.
What is Flask?
Flask is a lightweight and popular web framework written in Python. It is designed to be simple, flexible, and easy to use, providing the essentials for building web applications without imposing rigid structures or dependencies.
Flask's simplicity and flexibility make it ideal for building small to medium-sized applications, RESTful APIs, or prototypes.
Flask's minimalist approach gives developers fine-grained control over their application's architecture, allowing them to choose the best libraries and tools for their specific needs.
What is OpenTelemetry?
OpenTelemetry is an open source observability framework for OpenTelemetry tracing, logs, and metrics.
OpenTelemetry allows developers to collect and export telemetry data in a vendor-agnostic manner. With OpenTelemetry, you can instrument your application once and then add or change vendors without changing the instrumentation, for example, here is a list of popular DataDog competitors that support OpenTelemetry.
OpenTelemetry is available for most programming languages and provides interoperability across different languages and environments.
Flask instrumentation
OpenTelemetry provides instrumentations for various libraries and frameworks, including Flask. To instrument your Flask app, you need to install the corresponding OpenTelemetry Flask instrumentation:
You can use pip to install these packages:
pip install opentelemetry-api opentelemetry-sdk opentelemetry-instrumentation-flask
OpenTelemetry SDK
To initialize OpenTelemetry in your Flask application, add the following to your application's startup code, for example, in your app.py or wsgi.py file:
from opentelemetry import trace
from opentelemetry.sdk.trace import TracerProvider
from opentelemetry.sdk.trace.export import (
    BatchSpanProcessor,
    ConsoleSpanExporter,
)

provider = TracerProvider()
processor = BatchSpanProcessor(ConsoleSpanExporter())
provider.add_span_processor(processor)

# Sets the global default tracer provider
trace.set_tracer_provider(provider)

# Creates a tracer from the global tracer provider
tracer = trace.get_tracer("my.tracer.name")
Usage
After initializing OpenTelemetry Python SDK, you can instrument your Flask app:
from opentelemetry.instrumentation.flask import FlaskInstrumentor

app = Flask(__name__)
FlaskInstrumentor().instrument_app(app)
You can optionally configure Flask instrumentation to enable sqlcommenter, which adds contextual information to queries:
from opentelemetry.instrumentation.flask import FlaskInstrumentor

FlaskInstrumentor().instrument(enable_commenter=True, commenter_options={})
See example for details.
Instrumenting your code
OpenTelemetry can automatically trace incoming HTTP requests to your Flask application. You can also create custom spans to trace specific parts of your code.
For example:
from opentelemetry import trace

tracer = trace.get_tracer(__name__)

@app.route('/')
def index():
    # Create a custom span
    with tracer.start_as_current_span("custom-span"):
        # Your code here
    return "Hello, World!"
See OpenTelemetry Python Tracing API for details.
Instrumenting SQLAlchemy
To instrument SQLAlchemy database client, you need to install the corresponding SQLAlchemy instrumentation:
pip install opentelemetry-instrumentation-sqlalchemy
Then instrument the db engine:
from flask_sqlalchemy import SQLAlchemy
from opentelemetry.instrumentation.sqlalchemy import SQLAlchemyInstrumentor

app.config["SQLALCHEMY_DATABASE_URI"] = "sqlite:///:memory:"
db = SQLAlchemy(app)
SQLAlchemyInstrumentor().instrument(engine=db.engine)
See Instrumenting SQLAlchemy with OpenTelemetry for details.
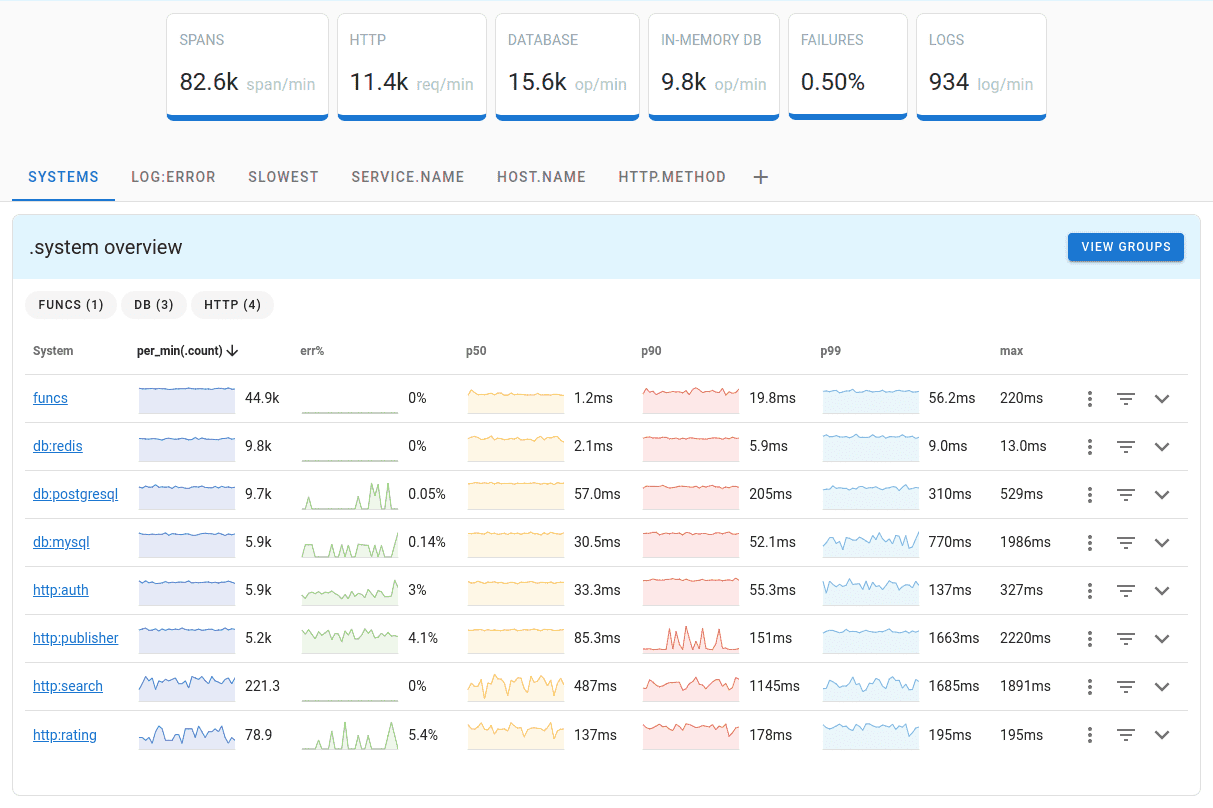
Once your Flask application is instrumented with OpenTelemetry, you can use the observability data in a variety of ways.
You can visualize distributed traces, analyze performance metrics, and gain insight into the behavior of your application using OpenTelemetry backends, such as Uptrace, Jaeger, Prometheus, or Grafana.
What is Uptrace?
Uptrace is a OpenTelemetry APM that supports distributed tracing, metrics, and logs. You can use it to monitor applications and troubleshoot issues.
Uptrace comes with an intuitive query builder, rich dashboards, alerting rules with notifications, and integrations for most languages and frameworks.
Uptrace can process billions of spans and metrics on a single server and allows you to monitor your applications at 10x lower cost.
In just a few minutes, you can try Uptrace by visiting the cloud demo (no login required) or running it locally with Docker. The source code is available on GitHub.
What's next?
Next, instrument more operations to get a more detailed picture. Try to prioritize network calls, disk operations, database queries, error and logs.
You can also create your own instrumentations using OpenTelemetry Python Tracing API.
More Flask examples:
Popular instrumentations: