OpenTelemetry Context Propagation [Go]
This guide covers Go-specific implementation of context propagation. For a comprehensive overview of context propagation concepts, W3C TraceContext, and troubleshooting, see the OpenTelemetry Context Propagation guide.
What is traceparent header?
The traceparent HTTP header contains information about the incoming request in a distributed tracing system, for example:
# {version}-{trace_id}-{span_id}-{trace_flags}
traceparent: 00-80e1afed08e019fc1110464cfa66635c-7a085853722dc6d2-01
You can find the traceparent header in HTTP responses using browser developer tools to extract trace IDs and locate specific traces in distributed tracing tools.
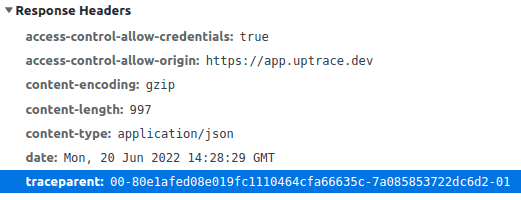
Using the header, you can extract a trace ID to find the trace in a distributed tracing tool. For example, from the header above, the trace ID is 80e1afed08e019fc1110464cfa66635c.
Traceparent header format
The traceparent header uses the version-trace_id-parent_id-trace_flags format where:
versionis always00trace_idis a hex-encoded trace ID (16 bytes, 32 hex characters)span_idis a hex-encoded span ID (8 bytes, 16 hex characters)trace_flagsis a hex-encoded 8-bit field containing tracing flags such as sampling
Automatic propagation
OpenTelemetry Go handles traceparent headers automatically when using instrumentation libraries. The otelhttp package automatically injects traceparent headers into outgoing HTTP requests and extracts them from incoming requests.
HTTP server with automatic extraction
import (
    "net/http"
    "go.opentelemetry.io/contrib/instrumentation/net/http/otelhttp"
)

func main() {
    // Create your HTTP handler
    mux := http.NewServeMux()
    mux.HandleFunc("/api/users", handleUsers)

    // Wrap with otelhttp for automatic propagation
    handler := otelhttp.NewHandler(mux, "my-service")

    http.ListenAndServe(":8080", handler)
}

func handleUsers(w http.ResponseWriter, r *http.Request) {
    // Traceparent header is automatically extracted
    // Current span context is available via r.Context()
    ctx := r.Context()

    // Use context for downstream operations
    processRequest(ctx)

    w.WriteHeader(http.StatusOK)
}
HTTP client with automatic injection
import (
    "net/http"
    "go.opentelemetry.io/contrib/instrumentation/net/http/otelhttp"
)

// Create instrumented HTTP client
client := &http.Client{
    Transport: otelhttp.NewTransport(http.DefaultTransport),
}

// All requests automatically include traceparent headers
req, _ := http.NewRequestWithContext(ctx, "GET", "https://api.example.com/data", nil)
resp, err := client.Do(req)
Manual propagation
When automatic instrumentation is not available, you can manually handle traceparent headers using OpenTelemetry's Propagators API.
Extracting from incoming requests
import (
    "net/http"
    "go.opentelemetry.io/otel"
    "go.opentelemetry.io/otel/propagation"
    "go.opentelemetry.io/otel/trace"
)

func handleRequest(w http.ResponseWriter, r *http.Request) {
    // Extract trace context from incoming request headers
    ctx := otel.GetTextMapPropagator().Extract(r.Context(),
        propagation.HeaderCarrier(r.Header))

    // Create span with extracted context
    ctx, span := tracer.Start(ctx, "handle_request",
        trace.WithSpanKind(trace.SpanKindServer),
    )
    defer span.End()

    // Process request with traced context
    result := processRequest(ctx)

    w.WriteHeader(http.StatusOK)
    w.Write([]byte(result))
}
Injecting into outgoing requests
import (
    "context"
    "net/http"
    "go.opentelemetry.io/otel"
    "go.opentelemetry.io/otel/propagation"
    "go.opentelemetry.io/otel/trace"
)

func makeRequest(ctx context.Context, url string) error {
    // Create a span for this operation
    ctx, span := tracer.Start(ctx, "http_request",
        trace.WithSpanKind(trace.SpanKindClient),
    )
    defer span.End()

    // Create HTTP request
    req, err := http.NewRequestWithContext(ctx, "GET", url, nil)
    if err != nil {
        return err
    }

    // Inject trace context into request headers
    otel.GetTextMapPropagator().Inject(ctx, propagation.HeaderCarrier(req.Header))

    // Make the request
    resp, err := http.DefaultClient.Do(req)
    if err != nil {
        span.RecordError(err)
        return err
    }
    defer resp.Body.Close()

    return nil
}
Injecting into response headers
You can inject the traceparent header into HTTP responses with the following middleware:
import (
    "net/http"
    "go.opentelemetry.io/otel"
    "go.opentelemetry.io/otel/propagation"
)

type TraceparentHandler struct {
    next  http.Handler
    props propagation.TextMapPropagator
}

func NewTraceparentHandler(next http.Handler) *TraceparentHandler {
    return &TraceparentHandler{
        next:  next,
        props: otel.GetTextMapPropagator(),
    }
}

func (h *TraceparentHandler) ServeHTTP(w http.ResponseWriter, req *http.Request) {
    // Inject traceparent into response headers
    h.props.Inject(req.Context(), propagation.HeaderCarrier(w.Header()))
    h.next.ServeHTTP(w, req)
}
Make sure to run the middleware after the first span is created:
import (
    "net/http"
    "go.opentelemetry.io/contrib/instrumentation/net/http/otelhttp"
)

func setupServer() {
    var handler http.Handler

    handler = router

    // First, use otelhttp to start a trace
    handler = otelhttp.NewHandler(handler, "")

    // Then, use the middleware to inject traceparent into responses
    handler = NewTraceparentHandler(handler)

    // Finally, serve requests
    http.ListenAndServe(":3000", handler)
}
Configuration
Configure propagation format using environment variables or programmatically:
import (
    "go.opentelemetry.io/otel"
    "go.opentelemetry.io/otel/propagation"
    "go.opentelemetry.io/contrib/propagators/b3"
)

// W3C TraceContext (recommended, default)
otel.SetTextMapPropagator(propagation.TraceContext{})

// W3C TraceContext + Baggage
otel.SetTextMapPropagator(propagation.NewCompositeTextMapPropagator(
    propagation.TraceContext{},
    propagation.Baggage{},
))

// Multiple formats for compatibility
otel.SetTextMapPropagator(propagation.NewCompositeTextMapPropagator(
    propagation.TraceContext{},  // W3C standard
    b3.New(),                     // Zipkin B3 format
    propagation.Baggage{},        // Baggage support
))
Baggage
You can use the baggagecopy package to read key/value pairs stored in baggage from the starting span's parent context and add them as attributes to the span.
import "go.opentelemetry.io/contrib/processors/baggagecopy"

uptrace.ConfigureOpentelemetry(
    uptrace.WithSpanProcessor(
        baggagecopy.NewSpanProcessor(nil),
    ),
)
Example
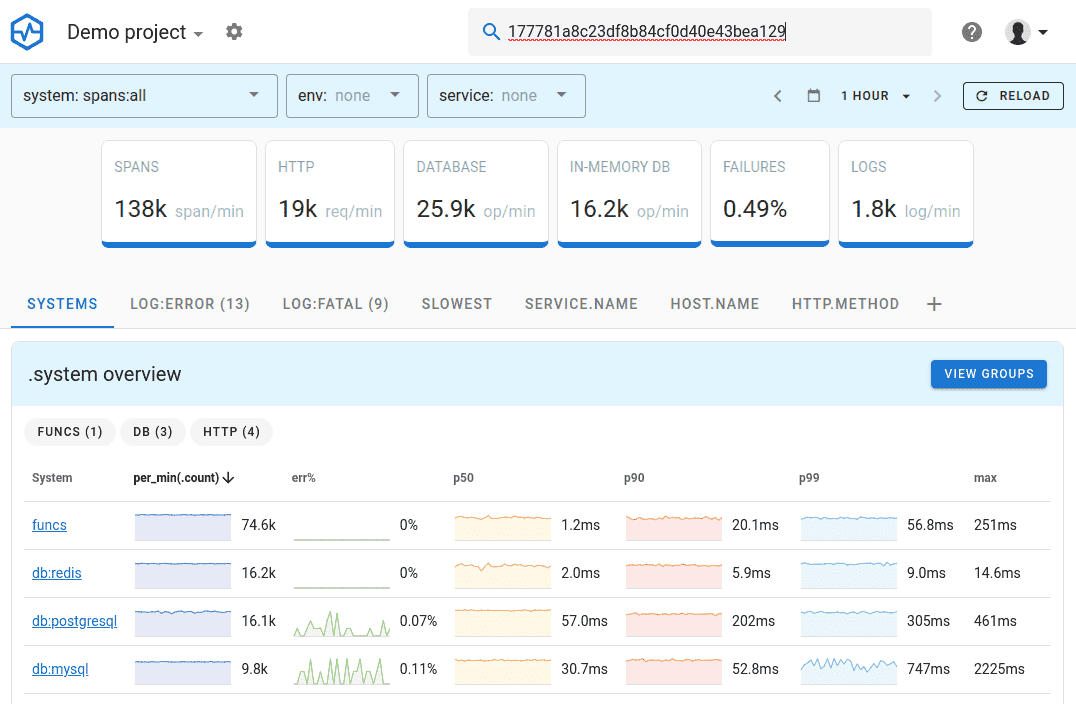
Uptrace is an OpenTelemetry APM that uses the TraceparentHandler middleware to add the traceparent header to all HTTP responses.
To see it in action:
- Navigate to Uptrace demo and open Chrome DevTools
- In the "Network" tab, click on an HTTP request and open the "Headers" tab
- Locate the
Traceparentheader and extract the trace ID to find the trace