Go Zero-Code Instrumentation with Uptrace (eBPF)

This guide explains how to automatically instrument Go applications using eBPF-based OpenTelemetry instrumentation. Unlike other languages, Go's compiled nature prevents traditional agent-based instrumentation, but eBPF technology enables automatic tracing at the kernel level without code changes or recompilation.
Beta Status: OpenTelemetry Go auto-instrumentation is in beta (as of January 2026). It's suitable for development and testing but should be carefully evaluated before production use.
Note: The examples below use Uptrace as the OTLP backend, but you can use any OpenTelemetry-compatible backend (Jaeger, Grafana Tempo, Prometheus, etc.) by changing the OTEL_EXPORTER_OTLP_ENDPOINT and removing Uptrace-specific headers.
What is eBPF-Based Instrumentation?
eBPF (Extended Berkeley Packet Filter) is a Linux kernel technology that allows running sandboxed programs at the kernel level. For Go applications, OpenTelemetry uses eBPF to intercept function calls and network operations without modifying or recompiling binaries.
How it works:
- eBPF programs attach to the Linux kernel
- When your Go application calls instrumented functions (HTTP, gRPC, SQL), eBPF intercepts the calls
- Telemetry data is collected at the kernel level
- Traces and metrics are exported to Uptrace via OTLP
Key difference from other languages: Unlike Java (bytecode manipulation), Python (monkey-patching), or Node.js (require hooks), Go instrumentation works at the kernel level rather than language runtime level.
Prerequisites
Before starting, ensure you have:
- Linux kernel 5.8+ (required for eBPF CO-RE support)
- Go 1.21+ application (compiled binary)
- CAP_SYS_ADMIN capability or root access (for eBPF operations)
- An Uptrace account with a DSN
Important: eBPF-based instrumentation requires Linux kernel 5.8 or higher and is not supported on Windows or macOS. For non-Linux environments or when eBPF is unavailable, use manual instrumentation instead.
Quick Start Guide
Step 1: Create an Uptrace Project
Create an Uptrace project to obtain a DSN (Data Source Name), for example, https://<secret>@api.uptrace.dev?grpc=4317.
Step 2: Download eBPF Instrumentation Binary
Download the OpenTelemetry Go auto-instrumentation binary:
# Download latest version
wget https://github.com/open-telemetry/opentelemetry-go-instrumentation/releases/latest/download/otel-go-instrumentation-linux-amd64

# Make executable
chmod +x otel-go-instrumentation-linux-amd64
Or for specific version:
# Download version 0.23.0
wget https://github.com/open-telemetry/opentelemetry-go-instrumentation/releases/download/v0.23.0/otel-go-instrumentation-linux-amd64
chmod +x otel-go-instrumentation-linux-amd64
Step 3: Build Your Go Application
Compile your Go application as usual. No special build flags required:
go build -o myapp .
Step 4: Run with eBPF Instrumentation
Run your application with eBPF instrumentation. Replace <FIXME> with your Uptrace DSN:
# Set environment variables
export OTEL_SERVICE_NAME=my-go-app
export OTEL_SERVICE_VERSION=1.0.0
export OTEL_TRACES_EXPORTER=otlp
export OTEL_EXPORTER_OTLP_ENDPOINT=https://api.uptrace.dev:4317
export OTEL_EXPORTER_OTLP_HEADERS=uptrace-dsn=<FIXME>
export OTEL_EXPORTER_OTLP_PROTOCOL=grpc

# Run with eBPF instrumentation (requires sudo or CAP_SYS_ADMIN)
sudo ./otel-go-instrumentation-linux-amd64 ./myapp
Permissions: eBPF requires elevated privileges. You can either run with sudo or grant CAP_SYS_ADMIN capability: sudo setcap cap_sys_admin+ep otel-go-instrumentation-linux-amd64
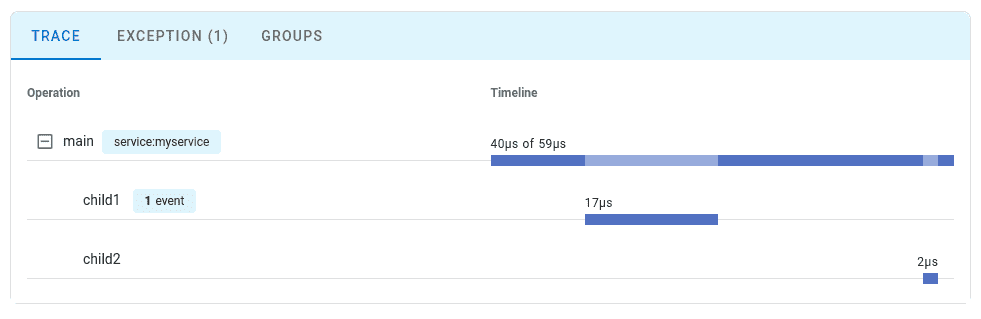
Step 5: View Your Trace
Navigate to the Uptrace UI to view your traces:
Auto-Instrumented Packages
OpenTelemetry Go eBPF instrumentation (beta) currently supports:
HTTP
net/http- HTTP server and client (incoming and outgoing requests)- HTTP methods, paths, status codes
- Request/response headers
- Timing information
Database
database/sql- SQL queries and connections (experimental)- Query execution
- Connection pooling
- Note: Query parameters are sanitized for security
gRPC
google.golang.org/grpc- gRPC client and server- Service and method names
- Status codes
- Timing information
Messaging
github.com/confluentinc/confluent-kafka-go/kafka- Kafka producer/consumer- Message publishing
- Message consumption
- Topic and partition information
Limited Coverage: eBPF instrumentation is more limited than manual instrumentation. It captures protocol-level operations (HTTP requests, SQL queries) but not application-specific business logic.
Configuration Options
Environment Variables
Common configuration options:
# Service identification
export OTEL_SERVICE_NAME=my-go-app
export OTEL_SERVICE_VERSION=1.0.0
export OTEL_RESOURCE_ATTRIBUTES=deployment.environment=production,service.namespace=backend

# Exporter configuration
export OTEL_TRACES_EXPORTER=otlp
export OTEL_METRICS_EXPORTER=otlp
export OTEL_EXPORTER_OTLP_ENDPOINT=https://api.uptrace.dev:4317
export OTEL_EXPORTER_OTLP_HEADERS=uptrace-dsn=<your_dsn>
export OTEL_EXPORTER_OTLP_PROTOCOL=grpc

# Sampling configuration
export OTEL_TRACES_SAMPLER=parentbased_traceidratio
export OTEL_TRACES_SAMPLER_ARG=0.1  # Sample 10% of traces

# Propagators
export OTEL_PROPAGATORS=tracecontext,baggage

# Logging
export OTEL_LOG_LEVEL=info
Command-Line Flags
The instrumentation binary supports additional flags:
# Enable debug mode
sudo ./otel-go-instrumentation-linux-amd64 --debug ./myapp

# Specify service name via flag
sudo ./otel-go-instrumentation-linux-amd64 --service-name my-go-app ./myapp

# Show version
./otel-go-instrumentation-linux-amd64 --version
Production Deployment
Docker Example
eBPF instrumentation requires privileged mode in Docker:
FROM golang:1.22-alpine AS builder
WORKDIR /app
COPY go.mod go.sum ./
RUN go mod download
COPY . .
RUN go build -o myapp .

FROM ubuntu:22.04
WORKDIR /app

# Install CA certificates for HTTPS
RUN apt-get update && apt-get install -y ca-certificates wget && rm -rf /var/lib/apt/lists/*

# Download eBPF instrumentation
RUN wget https://github.com/open-telemetry/opentelemetry-go-instrumentation/releases/latest/download/otel-go-instrumentation-linux-amd64 && \
    chmod +x otel-go-instrumentation-linux-amd64

# Copy application
COPY --from=builder /app/myapp .

# Configure OpenTelemetry
ENV OTEL_SERVICE_NAME=my-go-app
ENV OTEL_TRACES_EXPORTER=otlp
ENV OTEL_EXPORTER_OTLP_ENDPOINT=https://api.uptrace.dev:4317

# Run with eBPF instrumentation
CMD ["./otel-go-instrumentation-linux-amd64", "./myapp"]
Run with privileged mode:
docker run --privileged my-go-app:latest
Or with specific capability:
docker run --cap-add=SYS_ADMIN my-go-app:latest
Docker Compose Example
services:
  app:
    build: .
    cap_add:
      - SYS_ADMIN  # Required for eBPF
    environment:
      - OTEL_SERVICE_NAME=go-api
      - OTEL_SERVICE_VERSION=1.0.0
      - OTEL_TRACES_EXPORTER=otlp
      - OTEL_EXPORTER_OTLP_ENDPOINT=https://api.uptrace.dev:4317
      - OTEL_EXPORTER_OTLP_HEADERS=uptrace-dsn=${UPTRACE_DSN}
    ports:
      - "8080:8080"
Kubernetes Deployment
eBPF instrumentation in Kubernetes requires privileged security context:
apiVersion: apps/v1
kind: Deployment
metadata:
  name: go-app
spec:
  template:
    spec:
      containers:
      - name: app
        image: my-go-app:latest
        securityContext:
          privileged: true  # Required for eBPF
          capabilities:
            add:
            - SYS_ADMIN
        env:
        - name: OTEL_SERVICE_NAME
          value: "go-app"
        - name: OTEL_TRACES_EXPORTER
          value: "otlp"
        - name: OTEL_EXPORTER_OTLP_ENDPOINT
          value: "https://api.uptrace.dev:4317"
        - name: OTEL_EXPORTER_OTLP_HEADERS
          valueFrom:
            secretKeyRef:
              name: uptrace-secrets
              key: dsn
Security Consideration: Privileged containers have elevated permissions. Ensure proper Pod Security Policies (PSP) or Pod Security Standards (PSS) are in place.
For more details on Kubernetes deployment with eBPF, see the Kubernetes monitoring guide - eBPF section.
Troubleshooting
Issue: Permission Denied
Symptom: operation not permitted or permission denied errors.
Solution:
eBPF requires elevated privileges. Run with sudo or grant capabilities:
# Option 1: Run with sudo
sudo ./otel-go-instrumentation-linux-amd64 ./myapp

# Option 2: Grant capability (run once)
sudo setcap cap_sys_admin+ep otel-go-instrumentation-linux-amd64
./otel-go-instrumentation-linux-amd64 ./myapp
Issue: Kernel Version Too Old
Symptom: kernel version X.X not supported error.
Solution:
eBPF CO-RE requires Linux kernel 5.8+. Check your kernel version:
uname -r
# Should be >= 5.8.0
If your kernel is older, either upgrade the kernel or use manual instrumentation instead.
Issue: No Traces Appearing
Symptom: Application runs but no traces in Uptrace.
Solution:
- Enable debug mode to see what's being captured:
sudo OTEL_LOG_LEVEL=debug ./otel-go-instrumentation-linux-amd64 ./myapp
- Verify the OTLP endpoint is reachable:
curl -v https://api.uptrace.dev:4317
- Check that your application uses supported packages (
net/http,database/sql, etc.).
Issue: Missing Database Queries
Symptom: HTTP requests traced but SQL queries missing.
Solution:
Database/SQL instrumentation is experimental. Ensure you're using database/sql package directly, not ORM wrappers.
Issue: High Performance Overhead
Symptom: Application performance degraded significantly.
Solution:
eBPF overhead is typically <1%, but can increase with high request rates. Enable sampling:
export OTEL_TRACES_SAMPLER=parentbased_traceidratio
export OTEL_TRACES_SAMPLER_ARG=0.1  # Sample only 10%
Limitations of eBPF Instrumentation
eBPF-based instrumentation has significant limitations compared to manual instrumentation:
Protocol-Level Only
eBPF captures network operations but not application logic:
- ✅ HTTP requests (method, path, status code)
- ✅ SQL queries (sanitized statements)
- ❌ Business logic (user actions, calculations)
- ❌ Custom application metrics
No Business Context
Cannot capture domain-specific information:
// eBPF captures HTTP request: GET /orders/123
http.HandleFunc("/orders/", func(w http.ResponseWriter, r *http.Request) {
    // eBPF captures SQL query: SELECT * FROM orders WHERE id=?
    var order Order
    db.QueryRow("SELECT * FROM orders WHERE id=?", orderID).Scan(&order.ID, &order.Status)

    // NOT captured: business logic, user context, order details
    if order.Status == "premium" {
        applyDiscount(order)  // Business logic invisible to eBPF
    }
})
To add business context, combine eBPF with manual instrumentation:
import (
    "context"

    "go.opentelemetry.io/otel"
    "go.opentelemetry.io/otel/attribute"
)

var tracer = otel.Tracer("myapp")

func processOrder(ctx context.Context, orderID int64, userID int64) {
    // eBPF captures HTTP/SQL automatically
    // Add manual span for business logic
    ctx, span := tracer.Start(ctx, "process_order")
    defer span.End()

    userTier := getUserTier(userID)
    span.SetAttributes(
        attribute.Int64("order.id", orderID),
        attribute.Int64("user.id", userID),
        attribute.String("user.tier", userTier),
    )

    // Business logic with custom attributes
    order := getOrder(ctx, orderID)
    if userTier == "premium" {
        applyDiscounts(ctx, order)
        span.SetAttributes(attribute.Float64("discount.applied", order.Discount))
    }
}
Generic Span Names
eBPF generates generic names based on protocol operations:
- ❌ eBPF:
GET /api/users - ✅ Manual:
FetchActivePremiumUsers
Limited Package Support
Only a small subset of Go packages are instrumented (net/http, database/sql, gRPC, kafka-go). Custom protocols and libraries require manual instrumentation.
Beta Status
The technology is in beta as of January 2026. Expect:
- Potential breaking changes in future releases
- Limited community support compared to stable features
- Possible bugs or unexpected behavior
eBPF vs Manual Instrumentation
| Aspect | eBPF (Zero-Code) | Manual Instrumentation |
|---|---|---|
| Setup Time | 5-10 minutes | Hours to days |
| Code Changes | None | Extensive |
| Recompilation | Not required | Required for each change |
| Coverage | Protocol-level only (HTTP, SQL) | Full application including business logic |
| Business Context | None | Complete control |
| Performance Overhead | <1% | 1-3% |
| Platform Support | Linux only (kernel 5.8+) | All platforms |
| Maturity | Beta | Stable |
| Best For | Quick visibility, legacy binaries | Production apps, business metrics |
Recommendation: Use eBPF for quick proof-of-concept or when you can't modify source code. For production applications, use manual instrumentation or a hybrid approach (eBPF for protocol-level + manual for business logic).
When to Use eBPF Instrumentation
✅ Good for:
- Quick proof-of-concept without code changes
- Analyzing legacy binaries without source code
- Third-party Go applications you don't control
- Development and testing environments
❌ Not ideal for:
- Production applications requiring business metrics
- Windows or macOS environments
- Applications on older Linux kernels (<5.8)
- Fine-grained performance analysis
- Applications with custom protocols
Next Steps
- Learn about OpenTelemetry Go Tracing API for manual instrumentation
- Explore OpenTelemetry Go Metrics to track custom business KPIs
- Review Kubernetes eBPF deployment for cluster-wide setup
- Compare with framework-specific guides: Gin, Echo, Gorilla Mux