.NET Zero-Code Instrumentation with Uptrace

This guide explains how to automatically instrument .NET applications without modifying code using the OpenTelemetry .NET Automatic Instrumentation. The agent uses CLR profiling APIs to automatically detect and instrument popular .NET frameworks and libraries at runtime, exporting telemetry data to Uptrace using OTLP.
Note: The examples below use Uptrace as the OTLP backend, but you can use any OpenTelemetry-compatible backend (Jaeger, Grafana Tempo, Prometheus, etc.) by changing the OTEL_EXPORTER_OTLP_ENDPOINT and removing Uptrace-specific headers.
What is Zero-Code Instrumentation?
Zero-Code instrumentation (also called automatic instrumentation) allows you to collect telemetry data from .NET applications without modifying application code. The OpenTelemetry .NET automatic instrumentation uses CLR profiling APIs to intercept method calls in popular frameworks and libraries at runtime, automatically generating distributed traces, metrics, and logs.
How it works:
- Install the OpenTelemetry .NET automatic instrumentation package
- Set required environment variables for CLR profiling
- Run your application - the CLR profiler automatically instruments loaded assemblies
- Telemetry data is automatically collected and exported to Uptrace
Prerequisites
Before starting, ensure you have:
- .NET Core 6.0+ or .NET Framework 4.6.2+ (recommended: .NET 8)
- An existing .NET application (ASP.NET Core, console app, Windows Service, etc.)
- An Uptrace account with a DSN
Quick Start Guide
Important: .NET automatic instrumentation requires many environment variables for CLR profiling. For production use, we strongly recommend Docker or Kubernetes Operator to simplify configuration and avoid manual setup errors.
Step 1: Create an Uptrace Project
Create an Uptrace project to obtain a DSN (Data Source Name), for example, https://<secret>@api.uptrace.dev?grpc=4317.
Step 2: Install Automatic Instrumentation
Choose your installation method based on your operating system:
# Download installation script
curl -sSfL https://github.com/open-telemetry/opentelemetry-dotnet-instrumentation/releases/latest/download/otel-dotnet-auto-install.sh -O

# Run installer
sh ./otel-dotnet-auto-install.sh

# Make executable
chmod +x $HOME/.otel-dotnet-auto/instrument.sh
Step 3: Configure Environment Variables
Configure the agent to export data to Uptrace. Replace <FIXME> with your actual Uptrace DSN, and myservice with a name that identifies your application:
# Source the instrument script (sets all required CLR variables)
. $HOME/.otel-dotnet-auto/instrument.sh

# Configure OpenTelemetry
export OTEL_SERVICE_NAME=myservice
export OTEL_SERVICE_VERSION=1.0.0
export OTEL_TRACES_EXPORTER=otlp
export OTEL_METRICS_EXPORTER=otlp
export OTEL_LOGS_EXPORTER=otlp
export OTEL_EXPORTER_OTLP_ENDPOINT=https://api.uptrace.dev:4317
export OTEL_EXPORTER_OTLP_HEADERS=uptrace-dsn=<FIXME>
export OTEL_EXPORTER_OTLP_PROTOCOL=grpc
Note: The instrument.sh script (Linux/macOS) or Register-OpenTelemetryForCurrentSession (Windows) sets up all required CLR profiling environment variables. These include CORECLR_ENABLE_PROFILING, CORECLR_PROFILER, CORECLR_PROFILER_PATH, and others.
Step 4: Run Your Application
Run your .NET application as usual. The automatic instrumentation will activate through the CLR profiler:
# After sourcing instrument.sh
dotnet run
# or
dotnet MyApp.dll
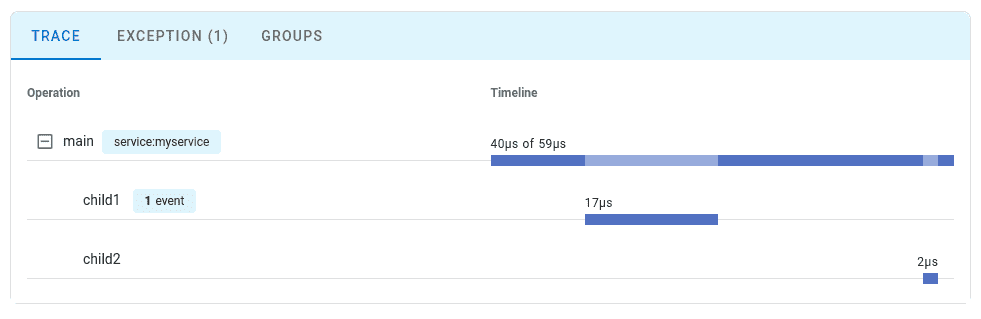
Step 5: View Your Trace
Navigate to the Uptrace UI to view your traces:
Auto-Instrumented Libraries
The OpenTelemetry .NET automatic instrumentation supports a wide variety of popular .NET libraries and frameworks:
Web Frameworks
- ASP.NET Core (6.0+) - MVC, Web API, minimal APIs
- ASP.NET Framework (4.6.2+) - MVC, Web API
- Blazor Server
- gRPC ASP.NET Core
HTTP Clients
HttpClient/HttpClientHandlerSystem.Net.Http.HttpRequestMessage- gRPC Client
Database Clients
- Entity Framework Core (6.0+)
- Entity Framework (6.0+)
- SQL Client (Microsoft.Data.SqlClient, System.Data.SqlClient)
- PostgreSQL (Npgsql)
- MySQL (MySql.Data, MySqlConnector)
- MongoDB (MongoDB.Driver)
- Redis (StackExchange.Redis)
- Elasticsearch.Net
- Cassandra (Cassandra.Driver)
Message Queues
- Azure Service Bus
- RabbitMQ (RabbitMQ.Client)
- Kafka (Confluent.Kafka)
- MassTransit
- NServiceBus
GraphQL & gRPC
- HotChocolate (GraphQL server)
- gRPC .NET
Logging Frameworks
- ILogger (Microsoft.Extensions.Logging)
- NLog
- Serilog
For the complete list of supported libraries, see the OpenTelemetry .NET Automatic Instrumentation Documentation.
Configuration Options
Environment Variables
Common configuration options for zero-code instrumentation:
# Service identification
export OTEL_SERVICE_NAME=my-dotnet-app
export OTEL_SERVICE_VERSION=1.0.0
export OTEL_RESOURCE_ATTRIBUTES=deployment.environment=production,service.namespace=backend

# Exporter configuration
export OTEL_TRACES_EXPORTER=otlp
export OTEL_METRICS_EXPORTER=otlp
export OTEL_LOGS_EXPORTER=otlp
export OTEL_EXPORTER_OTLP_ENDPOINT=https://api.uptrace.dev:4317
export OTEL_EXPORTER_OTLP_HEADERS=uptrace-dsn=<your_dsn>
export OTEL_EXPORTER_OTLP_PROTOCOL=grpc

# Sampling configuration
export OTEL_TRACES_SAMPLER=parentbased_traceidratio
export OTEL_TRACES_SAMPLER_ARG=0.1  # Sample 10% of traces

# Propagators
export OTEL_PROPAGATORS=tracecontext,baggage

# Logging
export OTEL_DOTNET_AUTO_LOG_DIRECTORY=/var/log/otel
For the full list of configuration options, see the OpenTelemetry .NET Configuration documentation.
Disabling Specific Instrumentations
Disable instrumentation for specific libraries:
# Disable all instrumentations for a signal type
export OTEL_DOTNET_AUTO_TRACES_INSTRUMENTATION_ENABLED=false  # Disable all traces
export OTEL_DOTNET_AUTO_METRICS_INSTRUMENTATION_ENABLED=false  # Disable all metrics

# Disable specific instrumentations
export OTEL_DOTNET_AUTO_TRACES_ASPNETCORE_INSTRUMENTATION_ENABLED=true
export OTEL_DOTNET_AUTO_TRACES_HTTPCLIENT_INSTRUMENTATION_ENABLED=true
export OTEL_DOTNET_AUTO_TRACES_ENTITYFRAMEWORKCORE_INSTRUMENTATION_ENABLED=false
Production Deployment
Docker Example
FROM mcr.microsoft.com/dotnet/sdk:8.0 AS build
WORKDIR /src
COPY ["MyApp/MyApp.csproj", "MyApp/"]
RUN dotnet restore "MyApp/MyApp.csproj"
COPY . .
WORKDIR "/src/MyApp"
RUN dotnet build "MyApp.csproj" -c Release -o /app/build
RUN dotnet publish "MyApp.csproj" -c Release -o /app/publish

FROM mcr.microsoft.com/dotnet/aspnet:8.0
WORKDIR /app
EXPOSE 80

# Install OpenTelemetry auto-instrumentation
ADD https://github.com/open-telemetry/opentelemetry-dotnet-instrumentation/releases/latest/download/otel-dotnet-auto-install.sh .
RUN apt-get update && apt-get install -y unzip && \
    sh ./otel-dotnet-auto-install.sh && \
    rm otel-dotnet-auto-install.sh

# Set CLR profiling environment variables
ENV OTEL_DOTNET_AUTO_HOME="/otel-dotnet-auto"
ENV CORECLR_ENABLE_PROFILING=1
ENV CORECLR_PROFILER={918728DD-259F-4A6A-AC2B-B85E1B658318}
ENV CORECLR_PROFILER_PATH="/otel-dotnet-auto/linux-x64/OpenTelemetry.AutoInstrumentation.Native.so"
ENV DOTNET_STARTUP_HOOKS="/otel-dotnet-auto/net/OpenTelemetry.AutoInstrumentation.StartupHook.dll"
ENV DOTNET_ADDITIONAL_DEPS="/otel-dotnet-auto/AdditionalDeps"
ENV DOTNET_SHARED_STORE="/otel-dotnet-auto/store"

# OpenTelemetry configuration
ENV OTEL_SERVICE_NAME=my-dotnet-app
ENV OTEL_TRACES_EXPORTER=otlp
ENV OTEL_METRICS_EXPORTER=otlp
ENV OTEL_EXPORTER_OTLP_ENDPOINT=https://api.uptrace.dev:4317
ENV OTEL_EXPORTER_OTLP_HEADERS="uptrace-dsn=<FIXME>"

COPY --from=build /app/publish .
ENTRYPOINT ["dotnet", "MyApp.dll"]
Docker Compose Example
services:
  api:
    build: .
    ports:
      - "8080:80"
    environment:
      - OTEL_SERVICE_NAME=aspnet-api
      - OTEL_SERVICE_VERSION=1.0.0
      - OTEL_TRACES_EXPORTER=otlp
      - OTEL_METRICS_EXPORTER=otlp
      - OTEL_EXPORTER_OTLP_ENDPOINT=https://api.uptrace.dev:4317
      - OTEL_EXPORTER_OTLP_HEADERS=uptrace-dsn=${UPTRACE_DSN}
      - OTEL_TRACES_SAMPLER=parentbased_traceidratio
      - OTEL_TRACES_SAMPLER_ARG=0.1
Kubernetes Deployment
For Kubernetes, use the OpenTelemetry Operator to inject auto-instrumentation automatically:
apiVersion: opentelemetry.io/v1alpha1
kind: Instrumentation
metadata:
  name: dotnet-instrumentation
  namespace: default
spec:
  exporter:
    endpoint: https://api.uptrace.dev:4317
  propagators:
    - tracecontext
    - baggage
  sampler:
    type: parentbased_traceidratio
    argument: "0.1"
  dotnet:
    image: ghcr.io/open-telemetry/opentelemetry-operator/autoinstrumentation-dotnet:latest
    env:
      - name: OTEL_EXPORTER_OTLP_HEADERS
        value: "uptrace-dsn=<your_dsn>"
Apply instrumentation to your deployment:
apiVersion: apps/v1
kind: Deployment
metadata:
  name: dotnet-app
spec:
  template:
    metadata:
      annotations:
        instrumentation.opentelemetry.io/inject-dotnet: "true"
    spec:
      containers:
      - name: app
        image: my-dotnet-app:latest
        env:
        - name: OTEL_SERVICE_NAME
          value: "dotnet-app"
For more details, see the Kubernetes monitoring guide.
Troubleshooting
Issue: No Traces Appearing
Symptom: Application runs but no traces appear in Uptrace.
Solution:
- Enable debug logging:
export OTEL_DOTNET_AUTO_LOG_DIRECTORY=/tmp/otel-logs
export OTEL_LOG_LEVEL=debug
- Check that CLR profiling is enabled. Look for these environment variables:
# Linux/macOS
env | grep CORECLR_PROFILER
env | grep DOTNET_STARTUP_HOOKS

# Windows PowerShell
Get-ChildItem Env: | Where-Object { $_.Name -like "*CORECLR*" }
- Verify the profiler library exists:
ls -la $CORECLR_PROFILER_PATH
# Should show: OpenTelemetry.AutoInstrumentation.Native.so (Linux) or .dll (Windows)
Issue: Application Fails to Start
Symptom: .NET application crashes on startup with profiler errors.
Solution:
Ensure all CLR profiling environment variables are set correctly. Missing or incorrect paths will prevent the app from starting:
# Linux/macOS - Use the instrument script
. $HOME/.otel-dotnet-auto/instrument.sh

# Windows - Use PowerShell module
Register-OpenTelemetryForCurrentSession

# Docker - Ensure paths match installation directory
ENV CORECLR_PROFILER_PATH="/otel-dotnet-auto/linux-x64/OpenTelemetry.AutoInstrumentation.Native.so"
Issue: Missing .NET Framework Support
Symptom: .NET Framework applications (4.6.2-4.8) don't generate traces.
Solution:
.NET Framework requires additional environment variables:
# Windows only (.NET Framework)
$env:COR_ENABLE_PROFILING=1
$env:COR_PROFILER="{918728DD-259F-4A6A-AC2B-B85E1B658318}"
$env:COR_PROFILER_PATH="C:\otel-dotnet-auto\win-x64\OpenTelemetry.AutoInstrumentation.Native.dll"
Note: .NET Framework support is Windows-only and requires separate configuration from .NET Core/.NET 5+.
Issue: High Performance Overhead
Symptom: Application response time increased significantly.
Solution:
- Enable sampling for high-traffic applications:
export OTEL_TRACES_SAMPLER=parentbased_traceidratio
export OTEL_TRACES_SAMPLER_ARG=0.1  # Sample only 10%
- Disable non-critical instrumentations:
export OTEL_DOTNET_AUTO_TRACES_ENTITYFRAMEWORKCORE_INSTRUMENTATION_ENABLED=false
export OTEL_DOTNET_AUTO_TRACES_HTTPCLIENT_INSTRUMENTATION_ENABLED=true
- Configure batch processor for efficient export:
export OTEL_BSP_SCHEDULE_DELAY=5000
export OTEL_BSP_MAX_EXPORT_BATCH_SIZE=512
Limitations of Zero-Code Instrumentation
While zero-code instrumentation provides comprehensive observability, it has some limitations:
Generic Span Names
Automatic instrumentation generates generic span names based on framework operations:
- ❌ Automatic:
GET /api/orders - ✅ Manual:
ProcessHighPriorityCustomerOrders
No Business Context
Zero-code instrumentation can't capture domain-specific information:
// Automatically traced (HTTP request)
[HttpGet("orders/{id}")]
public async Task<Order> GetOrder(int id)
{
    return await _orderService.GetByIdAsync(id);
}

// NOT traced (business logic details)
public async Task<Order> ProcessOrder(Order order, User user)
{
    // Business rules invisible without manual instrumentation
    if (user.IsPremium)
    {
        await ApplyDiscounts(order);
    }
    return order;
}
To add business context, combine zero-code with manual instrumentation:
using System.Diagnostics;

public class OrderService
{
    private static readonly ActivitySource ActivitySource = new("MyApp.Orders");

    public async Task<Order> ProcessOrder(Order order, User user)
    {
        // Zero-code instruments the HTTP layer automatically
        // Add manual span for business logic
        using var activity = ActivitySource.StartActivity("ProcessOrder");
        activity?.SetTag("order.id", order.Id);
        activity?.SetTag("user.id", user.Id);
        activity?.SetTag("user.tier", user.Tier);

        var result = await ApplyBusinessRules(order, user);
        activity?.SetTag("order.total", result.Total);

        return result;
    }
}
Framework Coverage Only
Only instrumented libraries generate spans. Custom utilities and proprietary frameworks remain invisible without manual instrumentation.
Performance Overhead
Instrumenting all libraries can introduce overhead:
- Typical overhead: 2-5% CPU increase
- Memory overhead: 30-80MB additional heap usage
- Startup time: +100-300ms depending on application size
Zero-Code vs Manual Instrumentation
| Aspect | Zero-Code | Manual |
|---|---|---|
| Setup Time | 10-15 minutes | Hours to days |
| Code Changes | None | Extensive |
| Coverage | Framework/library operations only | Full application including business logic |
| Customization | Limited to environment variables | Complete control over spans and attributes |
| Maintenance | Update agent only | Code changes for new instrumentation |
| Performance | Moderate (all libraries instrumented) | Lower (instrument only critical paths) |
| Best For | Quick start, legacy apps, proof-of-concept | Custom business metrics, fine-grained control |
Recommendation: Start with zero-code instrumentation for immediate visibility, then add tracing incrementally for business-critical operations.
Next Steps
- Learn about OpenTelemetry .NET Tracing API to add custom spans
- Configure OpenTelemetry Sampling for production environments
- Explore OpenTelemetry Metrics to track business KPIs
- Review Spring Boot monitoring guide for comparison with JVM-based frameworks