Node.js Zero-Code Instrumentation with Uptrace

This guide explains how to automatically instrument Node.js applications without modifying code using the @opentelemetry/auto-instrumentations-node package. The auto-instrumentation module uses require hooks to automatically detect and instrument popular Node.js frameworks and libraries, exporting telemetry data to Uptrace using OTLP.
Note: The examples below use Uptrace as the OTLP backend, but you can use any OpenTelemetry-compatible backend (Jaeger, Grafana Tempo, Prometheus, etc.) by changing the OTEL_EXPORTER_OTLP_ENDPOINT and removing Uptrace-specific headers.
What is Zero-Code Instrumentation?
Zero-code instrumentation (also called automatic instrumentation) allows you to collect telemetry data from Node.js applications without modifying application code. The OpenTelemetry Node.js agent uses require hooks to intercept module loading and automatically patches popular libraries at runtime, generating distributed traces, metrics, and logs.
How it works:
- Install the
@opentelemetry/auto-instrumentations-nodepackage - Use the
--requireflag to load auto-instrumentation before your application starts - Auto-instrumentation patches popular frameworks (Express, Fastify, etc.) at require time
- Telemetry data is automatically collected and exported to Uptrace
Prerequisites
Before starting, ensure you have:
- Node.js 18+ (for
--requiresupport) - npm or yarn package manager
- An existing Node.js application (Express, Next.js, Fastify, etc.)
- An Uptrace account with a DSN
Quick Start Guide
Follow these steps to get your first auto-instrumented trace running in 5 minutes.
Step 1: Create an Uptrace Project
Create an Uptrace project to obtain a DSN (Data Source Name), for example, https://<secret>@api.uptrace.dev?grpc=4317.
Step 2: Install Auto-Instrumentation
Install the OpenTelemetry auto-instrumentation packages:
npm install --save @opentelemetry/api @opentelemetry/auto-instrumentations-node
Step 3: Configure Environment Variables
Configure the agent to export data to Uptrace. Replace <FIXME> with your actual Uptrace DSN, and myservice with a name that identifies your application:
export OTEL_SERVICE_NAME=myservice
export OTEL_SERVICE_VERSION=1.0.0
export OTEL_TRACES_EXPORTER=otlp
export OTEL_METRICS_EXPORTER=otlp
export OTEL_LOGS_EXPORTER=otlp
export OTEL_EXPORTER_OTLP_ENDPOINT=https://api.uptrace.dev:443
export OTEL_EXPORTER_OTLP_HEADERS=uptrace-dsn=<FIXME>
export OTEL_EXPORTER_OTLP_PROTOCOL=http/protobuf
Note: OpenTelemetry Node.js defaults to HTTP/Protobuf protocol (port 4318). Ensure you use the correct port for your protocol.
Step 4: Run Your Application
Use the --require flag to load auto-instrumentation before your application starts:
node --require @opentelemetry/auto-instrumentations-node/register app.js
Or use NODE_OPTIONS environment variable:
export NODE_OPTIONS="--require @opentelemetry/auto-instrumentations-node/register"
node app.js
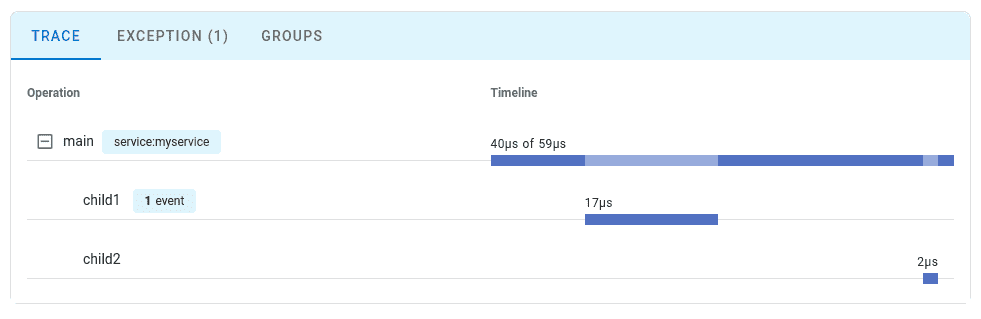
Step 5: View Your Trace
Navigate to the Uptrace UI to view your traces:
Auto-Instrumented Libraries
The @opentelemetry/auto-instrumentations-node package automatically instruments the following popular Node.js libraries:
Web Frameworks
- Express - automatic request/response tracing and middleware
- Fastify - async request handling and lifecycle hooks
- Koa - context-based middleware instrumentation
- Nest.js - controller and provider instrumentation
- Hapi - server and route instrumentation
HTTP Clients
http/https(Node.js core) - outbound HTTP requests- axios - promise-based HTTP client
- node-fetch - fetch API implementation
- undici - high-performance HTTP client
- got - simplified HTTP requests
Database Clients
pg(PostgreSQL) - queries and connection pooling- mysql, mysql2 - database operations
- mongodb - collection operations and queries
- ioredis, redis (Redis) - commands and pipelines
- sequelize - ORM operations
Message Queues
- amqplib (RabbitMQ) - message publishing and consuming
- kafkajs (Kafka) - producer and consumer
- aws-sdk (SQS) - message queue operations
GraphQL & gRPC
- graphql - query execution and resolvers
- @grpc/grpc-js - client and server calls
Other Libraries
- fs (file system) - file operations
- dns - DNS lookups
- winston, pino, bunyan (logging) - log correlation with traces
For the complete list of supported libraries, see the OpenTelemetry Registry.
Configuration Options
Environment Variables
Common configuration options for zero-code instrumentation:
# Service identification
export OTEL_SERVICE_NAME=my-nodejs-app
export OTEL_SERVICE_VERSION=1.0.0
export OTEL_RESOURCE_ATTRIBUTES=deployment.environment=production,service.namespace=backend

# Exporter configuration
export OTEL_TRACES_EXPORTER=otlp
export OTEL_METRICS_EXPORTER=otlp
export OTEL_LOGS_EXPORTER=otlp
export OTEL_EXPORTER_OTLP_ENDPOINT=https://api.uptrace.dev:443
export OTEL_EXPORTER_OTLP_HEADERS=uptrace-dsn=<your_dsn>
export OTEL_EXPORTER_OTLP_PROTOCOL=http/protobuf

# Sampling configuration
export OTEL_TRACES_SAMPLER=parentbased_traceidratio
export OTEL_TRACES_SAMPLER_ARG=0.1  # Sample 10% of traces

# Propagators
export OTEL_PROPAGATORS=tracecontext,baggage

# Logging
export OTEL_LOG_LEVEL=info
For the full list of configuration options, see the OpenTelemetry Node.js Configuration documentation.
Disabling Specific Instrumentations
If you need to disable instrumentation for specific libraries, create a custom instrumentation file:
// instrumentation.js
const { NodeSDK } = require('@opentelemetry/sdk-node');
const { getNodeAutoInstrumentations } = require('@opentelemetry/auto-instrumentations-node');
const { OTLPTraceExporter } = require('@opentelemetry/exporter-trace-otlp-http');

const sdk = new NodeSDK({
  traceExporter: new OTLPTraceExporter({
    url: process.env.OTEL_EXPORTER_OTLP_ENDPOINT + '/v1/traces',
    headers: {
      'uptrace-dsn': '<your_dsn>' // Replace with your Uptrace DSN
    }
  }),
  instrumentations: [
    getNodeAutoInstrumentations({
      // Disable specific instrumentations
      '@opentelemetry/instrumentation-fs': { enabled: false },
      '@opentelemetry/instrumentation-dns': { enabled: false },
      // Configure specific instrumentations
      '@opentelemetry/instrumentation-http': {
        enabled: true,
        ignoreIncomingRequestHook: (req) => {
          // Ignore health checks
          return req.url === '/health' || req.url === '/metrics';
        }
      }
    })
  ]
});

sdk.start();
Then run with your custom instrumentation:
node --require ./instrumentation.js app.js
Production Deployment
Docker Example
FROM node:20-slim

WORKDIR /app

# Copy package files (ensure @opentelemetry/api and
# @opentelemetry/auto-instrumentations-node are in package.json)
COPY package*.json ./
RUN npm ci --only=production

# Copy application files
COPY . .

# Configure OpenTelemetry
ENV OTEL_SERVICE_NAME=my-nodejs-app
ENV OTEL_TRACES_EXPORTER=otlp
ENV OTEL_EXPORTER_OTLP_ENDPOINT=https://api.uptrace.dev:443
ENV OTEL_EXPORTER_OTLP_HEADERS=uptrace-dsn=<your_dsn>
ENV NODE_OPTIONS="--require @opentelemetry/auto-instrumentations-node/register"

# Run application
CMD ["node", "app.js"]
Docker Compose Example
version: '3.8'

services:
  api:
    build: .
    ports:
      - "3000:3000"
    environment:
      - OTEL_SERVICE_NAME=express-api
      - OTEL_SERVICE_VERSION=1.0.0
      - OTEL_TRACES_EXPORTER=otlp
      - OTEL_METRICS_EXPORTER=otlp
      - OTEL_EXPORTER_OTLP_ENDPOINT=https://api.uptrace.dev:443
      - OTEL_EXPORTER_OTLP_HEADERS=uptrace-dsn=${UPTRACE_DSN}
      - NODE_OPTIONS=--require @opentelemetry/auto-instrumentations-node/register
PM2 Ecosystem File
// ecosystem.config.js
module.exports = {
  apps: [{
    name: 'my-app',
    script: './app.js',
    instances: 4,
    exec_mode: 'cluster',
    node_args: '--require @opentelemetry/auto-instrumentations-node/register',
    env: {
      NODE_ENV: 'production',
      OTEL_SERVICE_NAME: 'my-nodejs-app',
      OTEL_TRACES_EXPORTER: 'otlp',
      OTEL_EXPORTER_OTLP_ENDPOINT: 'https://api.uptrace.dev:443',
      OTEL_EXPORTER_OTLP_HEADERS: 'uptrace-dsn=<your_dsn>'
    }
  }]
};
Run with PM2:
pm2 start ecosystem.config.js
Systemd Service Example
[Unit]
Description=My Node.js Application
After=network.target

[Service]
Type=simple
User=nodejs
WorkingDirectory=/opt/myapp
Environment="NODE_ENV=production"
Environment="OTEL_SERVICE_NAME=my-nodejs-app"
Environment="OTEL_TRACES_EXPORTER=otlp"
Environment="OTEL_EXPORTER_OTLP_ENDPOINT=https://api.uptrace.dev:443"
Environment="OTEL_EXPORTER_OTLP_HEADERS=uptrace-dsn=<your_dsn>"
Environment="NODE_OPTIONS=--require @opentelemetry/auto-instrumentations-node/register"
ExecStart=/usr/bin/node /opt/myapp/app.js
Restart=always

[Install]
WantedBy=multi-user.target
Kubernetes Deployment
For Kubernetes, use the OpenTelemetry Operator to inject auto-instrumentation automatically:
apiVersion: opentelemetry.io/v1alpha1
kind: Instrumentation
metadata:
  name: nodejs-instrumentation
  namespace: default
spec:
  exporter:
    endpoint: https://api.uptrace.dev:4317
  propagators:
    - tracecontext
    - baggage
  sampler:
    type: parentbased_traceidratio
    argument: "1.0"
  nodejs:
    image: ghcr.io/open-telemetry/opentelemetry-operator/autoinstrumentation-nodejs:latest
    env:
      - name: OTEL_EXPORTER_OTLP_HEADERS
        value: "uptrace-dsn=<your_dsn>"
Apply instrumentation to your deployment:
apiVersion: apps/v1
kind: Deployment
metadata:
  name: nodejs-app
spec:
  template:
    metadata:
      annotations:
        instrumentation.opentelemetry.io/inject-nodejs: "true"
    spec:
      containers:
      - name: app
        image: my-nodejs-app:latest
        env:
        - name: OTEL_SERVICE_NAME
          value: "nodejs-app"
For more details, see the Kubernetes monitoring guide.
Troubleshooting
Issue: No Traces Appearing
Symptom: Application runs but no traces appear in Uptrace.
Solution:
- Enable debug logging to see what's happening:
export OTEL_LOG_LEVEL=debug
node --require @opentelemetry/auto-instrumentations-node/register app.js
- Verify the auto-instrumentation module is loaded:
// Add at the top of your app.js
console.log('Auto-instrumentation loaded:', process.env.NODE_OPTIONS);
- Check that the OTLP endpoint is reachable:
curl -v https://api.uptrace.dev:443/v1/traces
Issue: Application Crashes on Startup
Symptom: Application fails to start with module loading errors.
Solution:
Ensure auto-instrumentation is loaded BEFORE any other modules. The --require flag runs before your application code:
# Correct
node --require @opentelemetry/auto-instrumentations-node/register app.js

# Incorrect (too late)
# Don't require instrumentation inside your app code
Issue: Missing Spans for Some HTTP Requests
Symptom: Some HTTP requests don't appear in traces.
Solution:
Check if you're filtering requests in middleware. Auto-instrumentation creates spans for all requests unless explicitly filtered:
// instrumentation.js
const sdk = new NodeSDK({
  instrumentations: [
    getNodeAutoInstrumentations({
      '@opentelemetry/instrumentation-http': {
        ignoreIncomingRequestHook: (req) => {
          // Only ignore actual health checks
          return req.url === '/health';
        }
      }
    })
  ]
});
Issue: High Memory Usage
Symptom: Memory consumption increased significantly after enabling auto-instrumentation.
Solution:
- Reduce sampling rate for high-traffic applications:
export OTEL_TRACES_SAMPLER=parentbased_traceidratio
export OTEL_TRACES_SAMPLER_ARG=0.1  # Sample only 10% of traces
- Disable filesystem and DNS instrumentation (high volume):
// instrumentation.js
instrumentations: [
  getNodeAutoInstrumentations({
    '@opentelemetry/instrumentation-fs': { enabled: false },
    '@opentelemetry/instrumentation-dns': { enabled: false }
  })
]
- Configure batch span processor for efficient export:
const { BatchSpanProcessor } = require('@opentelemetry/sdk-trace-base');

const sdk = new NodeSDK({
  spanProcessor: new BatchSpanProcessor(traceExporter, {
    maxQueueSize: 2048,
    scheduledDelayMillis: 5000,
    exportTimeoutMillis: 30000
  })
});
Issue: ESM Applications Not Instrumented
Symptom: ES modules applications don't generate traces.
Solution:
For ES modules (type: "module" in package.json), use the experimental loader:
# Node.js 20+
node --import @opentelemetry/auto-instrumentations-node/register app.mjs
Or for older Node.js versions:
node --loader @opentelemetry/auto-instrumentations-node/hook.mjs app.mjs
Note: ESM instrumentation support is experimental and may have limitations compared to CommonJS.
Limitations of Zero-Code Instrumentation
While zero-code instrumentation provides quick observability, it has some limitations:
Generic Span Names
Automatic instrumentation generates generic span names based on framework operations:
- ❌ Automatic:
GET /api/users - ✅ Manual:
fetch_premium_users_with_active_subscriptions
No Business Context
Zero-code instrumentation can't capture domain-specific information like user IDs, order amounts, or custom business logic:
// Automatically traced (HTTP request)
const response = await fetch('https://api.example.com/data');

// NOT traced (custom business logic)
function calculateDiscount(user, cart) {
  // This logic is invisible without manual instrumentation
  return applyBusinessRules(user, cart);
}
To add business context, combine zero-code with tracing:
const { trace } = require('@opentelemetry/api');

const tracer = trace.getTracer('my-app');

async function processOrder(orderId, userId) {
  // Zero-code instruments the HTTP framework automatically
  // Add manual span for business logic
  return await tracer.startActiveSpan('process_order', async (span) => {
    span.setAttribute('order.id', orderId);
    span.setAttribute('user.id', userId);
    span.setAttribute('user.tier', await getUserTier(userId));

    try {
      const result = await applyDiscountRules(orderId, userId);
      span.setAttribute('order.total', result.total);
      return result;
    } finally {
      span.end();
    }
  });
}
Framework Coverage Only
Only instrumented libraries generate spans. Core Node.js modules and custom utilities may remain invisible without manual instrumentation.
Performance Overhead
Instrumenting all libraries can introduce overhead:
- Typical overhead: 2-5% CPU increase
- Memory overhead: 30-80MB additional heap usage
- Startup time: +100-300ms depending on number of instrumented libraries
For performance-critical applications, consider selective tracing instead.
Zero-Code vs Manual Instrumentation
| Aspect | Zero-Code | Manual |
|---|---|---|
| Setup Time | 5-10 minutes | Hours to days |
| Code Changes | None | Extensive |
| Coverage | Framework/library operations only | Full application including business logic |
| Customization | Limited to environment variables | Complete control over spans and attributes |
| Maintenance | Update packages only | Code changes for new instrumentation |
| Performance | Moderate (all libraries instrumented) | Lower (instrument only critical paths) |
| Best For | Quick start, legacy apps, proof-of-concept | Custom business metrics, fine-grained control |
Recommendation: Start with zero-code instrumentation for immediate visibility, then add tracing incrementally for business-critical operations.
Next Steps
- Learn about OpenTelemetry Node.js Tracing API to add custom spans
- Configure OpenTelemetry Sampling for production environments
- Explore OpenTelemetry Metrics to track business KPIs
- Review Node.js monitoring guide for best practices
- Compare with manual Express instrumentation for hybrid approaches