Install Uptrace

To install Uptrace on your computer, you need to:
- Create a ClickHouse database to store telemetry data.
- Create a PostgreSQL database to store users and projects.
- Install Uptrace binary.
- Start sending data using OpenTelemetry protocol.
- Enjoy! 🎉
TIP
Docker example can get you started with Uptrace in no time. If you are using Kubernetes, you can also try Uptrace Helm chart.
Configuration
All Uptrace configuration is done with a single YAML file that can be downloaded from GitHub:
wget https://raw.githubusercontent.com/uptrace/uptrace/master/config/uptrace.dist.yml
mv uptrace.dist.yml uptrace.yml
You can then specify the config file location when starting Uptrace:
uptrace --config=/path/to/uptrace.yml serve
See Configuration for more details.
ClickHouse
Uptrace requires a ClickHouse database to store telemetry data such as traces, logs, and metrics. ClickHouse is an open source columnar database management system designed to handle large amounts of data and execute complex analytical queries with low latency.
After installing ClickHouse, you can create uptrace database like this:
clickhouse-client -q "CREATE DATABASE uptrace"
On startup, Uptrace connects to the ClickHouse database specified in the uptrace.yml configuration file and automatically creates the required tables and views.
# uptrace.yml

ch:
  addr: localhost:9000
  user: default
  password:
  database: uptrace
PostgreSQL
Uptrace also requires a PostgreSQL database to store metadata such as metric names and alerts. Typically, the PostgreSQL database requires only a few megabytes of disk space.
After installing PostgreSQL, you can create database like this:
sudo -u postgres psql
postgres=# create database uptrace;
postgres=# create user uptrace with encrypted password 'uptrace';
postgres=# grant all privileges on database uptrace to uptrace;
postgres=# \c uptrace
postgres=# grant all on schema public to uptrace;
On startup, Uptrace connects to the PostgreSQL database specified in the uptrace.yml configuration file and automatically creates the required tables and views.
# uptrace.yml

pg:
  addr: localhost:5432
  user: uptrace
  password: uptrace
  database: uptrace
Installation
Packages
Uptrace provides DEB and RPM packages for Linux amd64/arm64 systems. After installing the approriate package, you will have:
- Uptrace binary at
/usr/bin/uptrace. - Uptrace config at
/etc/uptrace/uptrace.yml. - Systemd service at
/lib/systemd/system/uptrace.service. - Environment file used by the systemd service at
/etc/uptrace/uptrace.conf.
To check the status of Uptrace service:
sudo systemctl status uptrace
To restart Uptrace:
sudo systemctl restart uptrace
To view Uptrace logs:
sudo journalctl -u uptrace -f
DEB
To install Debian package, run the following command replacing 1.0.0 with the desired version and amd64 with the desired architecture:
wget https://github.com/uptrace/uptrace/releases/download/v1.0.0/uptrace_1.0.0_amd64.deb
sudo dpkg -i uptrace_1.0.0_amd64.deb
RPM
To install RPM package, run the following command replacing 1.0.0 with the desired version and x86_64 with the desired architecture:
wget https://github.com/uptrace/uptrace/releases/download/v1.0.0/uptrace-1.0.0-1.x86_64.rpm
sudo rpm -ivh uptrace-1.0.0-1.x86_64.rpm
Binaries
Alternatively, instead of installing DEB or RPM packages, you can download a pre-compiled binary and install Uptrace manually.
Linux
Download Linux binary:
wget -O ./uptrace https://github.com/uptrace/uptrace/releases/download/v1.0.0/uptrace_linux_amd64
chmod +x ./uptrace
Download Uptrace config:
wget https://raw.githubusercontent.com/uptrace/uptrace/master/config/uptrace.dist.yml
mv uptrace.dist.yml uptrace.yml
Start Uptrace:
./uptrace --config=uptrace.yml serve
MacOS
Download MacOS binary:
wget -O uptrace https://github.com/uptrace/uptrace/releases/download/v1.0.0/uptrace_darwin_amd64
chmod +x uptrace
Download Uptrace config:
wget https://raw.githubusercontent.com/uptrace/uptrace/master/config/uptrace.dist.yml
mv uptrace.dist.yml uptrace.yml
Start Uptrace:
./uptrace --config=uptrace.yml serve
You may need to update ClickHouse connection string in uptrace.yml using ch.dsn option.
Windows
Download Windows binary:
curl uptrace https://github.com/uptrace/uptrace/releases/download/v1.0.0/uptrace_windows_amd64.exe
Download Uptrace config:
curl https://raw.githubusercontent.com/uptrace/uptrace/master/config/uptrace.dist.yml
mv uptrace.dist.yml uptrace.yml
Start Uptrace:
uptrace_windows_amd64.exe --config=uptrace.yml serve
You may need to update ClickHouse connection string in uptrace.yml using ch.dsn option.
Other
For pre-compiled binaries for other platforms, check GitHub Releases.
Start sending data
To start sending data, you can use OpenTelemetry distros that are pre-configured to work with Uptrace. Uptrace uses OpenTelemetry protocol (OTLP) to receive telemetry data such as traces, metrics, and logs. As a transport protocol, OTLP can use gRPC (OTLP/gRPC) or HTTP (OTLP/HTTP).
Uptrace supports OTLP/gRPC on the port 14317 and OTLP/HTTP on the port 14318. Both ports are specified in the Uptrace DSN that you will receive after installing Uptrace, for example:
UPTRACE_DSN=http://project2_secret_token@localhost:14318?grpc=14317
| Distro | Protocol | Port |
|---|---|---|
| OpenTelemetry Go | OTLP/gRPC | 14317 |
| OpenTelemetry .NET | OTLP/gRPC | 14317 |
| OpenTelemetry Python | OTLP/gRPC | 14317 |
| OpenTelemetry Rust | OTLP/gRPC | 14317 |
| OpenTelemetry Node.js | OTLP/HTTP | 14318 |
| OpenTelemetry Ruby | OTLP/HTTP | 14318 |
| OpenTelemetry Java | OTLP/HTTP | 14317 |
| OpenTelemetry PHP | OTLP/HTTP | 14318 |
| OpenTelemetry Erlang/Elixir | OTLP/gRPC | 14317 |
GitHub notifications
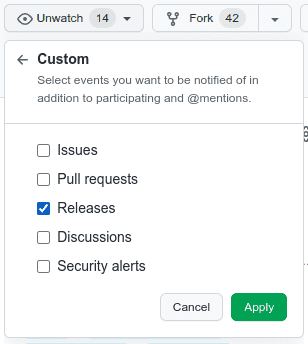
To get notified about a new Uptrace release, star the uptrace/uptrace repo and subscribe to notifications.
- Click on "Watch" -> "Custom".
- Select "Releases".
- Click on "Apply" to save changes.

What's next?
Next, learn how to configure Uptrace for your needs or browse available OpenTelemetry instrumentations to find examples for your frameworks and libraries.