Monitoring Redis Performance using OpenTelemetry

Monitoring Redis performance is crucial to ensure optimal operation and identify any potential bottlenecks or issues.
To monitor Redis performance, you can use OpenTelemetry Collector to collect metrics and Uptrace to visualize them..
What is OpenTelemetry Collector?
OpenTelemetry Collector facilitates the collection, processing, and export of telemetry data from multiple sources. It acts as an intermediary between applications and observability backends, enabling unified data collection and export.
With OpenTelemetry Collector, you can centralize and standardize your telemetry data collection, apply data processing operations, and seamlessly export data to multiple OpenTelemetry backends. It supports a range of processors that can manipulate data, apply sampling strategies, and perform other data transformations based on your requirements.
OpenTelemetry Redis receiver
To start monitoring Redis with Otel Collector, you need to configure Redis receiver in /etc/otel-contrib-collector/config.yaml using Uptrace DSN:
receivers:
  otlp:
    protocols:
      grpc:
      http:
  redis:
    endpoint: localhost:6379
    collection_interval: 10s

exporters:
  otlp:
    endpoint: otlp.uptrace.dev:4317
    headers: { 'uptrace-dsn': '<FIXME>' }

processors:
  resourcedetection:
    detectors: [env, system]
  cumulativetodelta:
  batch:
    timeout: 10s

service:
  pipelines:
    traces:
      receivers: [otlp]
      processors: [batch]
      exporters: [otlp]
    metrics:
      receivers: [otlp, redis]
      processors: [cumulativetodelta, batch, resourcedetection]
      exporters: [otlp]
Don't forget to restart the service:
sudo systemctl restart otelcol-contrib
You can also check OpenTelemetry Collector logs for any errors:
sudo journalctl -u otelcol-contrib -f
Redis receiver provides configuration options to collect specific metrics, enable or disable tracing, define sampling rates for traces, and configure log collection settings.
By utilizing the OpenTelemetry Redis receiver, you can capture and collect telemetry data from Redis, enabling you to gain insights into the performance, behavior, and usage patterns of your Redis instances. This data can be invaluable for monitoring, troubleshooting, and optimizing the performance of your Redis infrastructure.
OpenTelemetry Backend
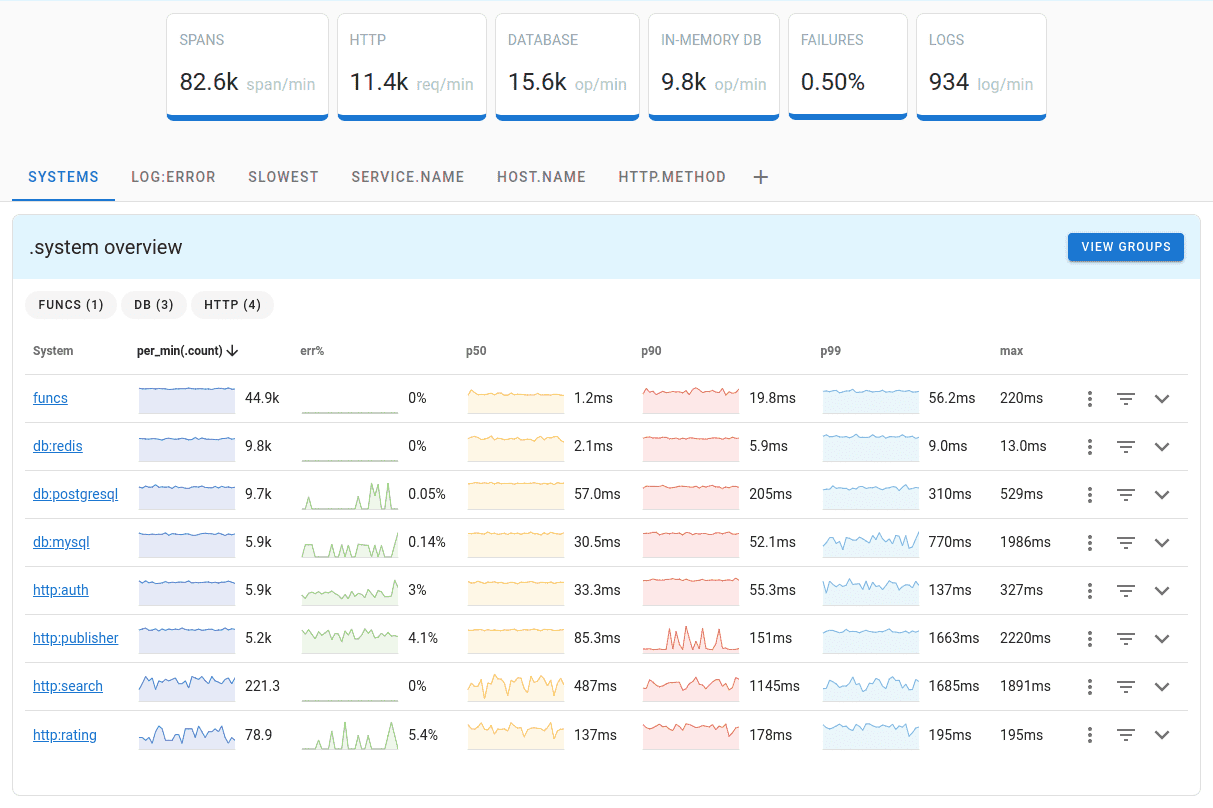
Once the metrics are collected and exported, you can visualize them using a compatible backend system. For example, you can use Uptrace to create dashboards that display metrics from the OpenTelemetry Collector.
Uptrace is a OpenTelemetry backend that supports distributed tracing, metrics, and logs. You can use it to monitor applications and troubleshoot issues.

Uptrace comes with an intuitive query builder, rich dashboards, alerting rules with notifications, and integrations for most languages and frameworks.
Uptrace can process billions of spans and metrics on a single server and allows you to monitor your applications at 10x lower cost.
In just a few minutes, you can try Uptrace by visiting the cloud demo (no login required) or running it locally with Docker. The source code is available on GitHub.
Available metrics
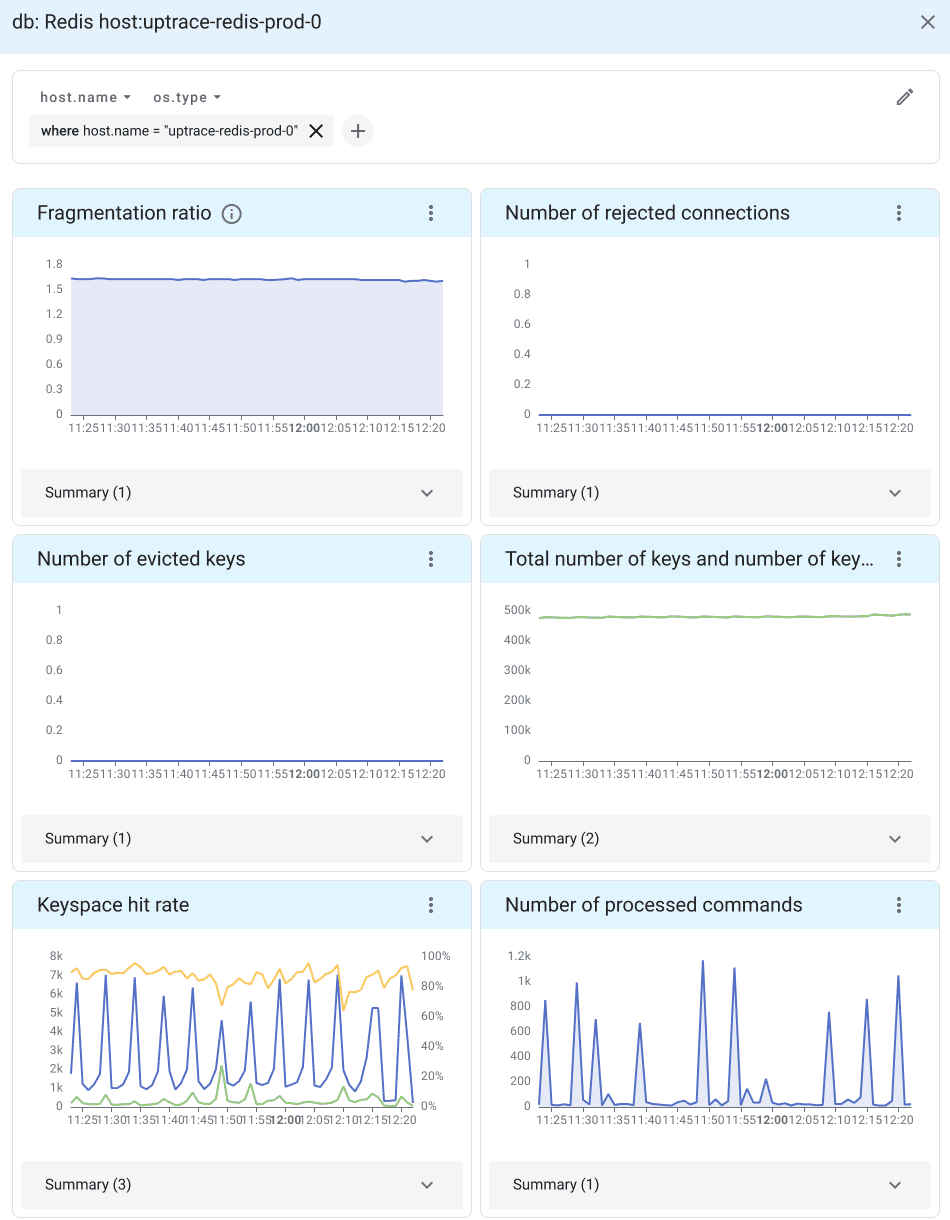
When telemetry data reaches Uptrace, it automatically generates a Redis dashboard from a pre-defined template.

What's next?
Next, you can learn more about configuring OpenTelemetry Collector. To start using OpenTelemetry and Uptrace, see Getting started with Uptrace.