Uptrace: OpenTelemetry APM at scale
OpenTelemetry APM (Application Performance Monitoring) is a tool that helps developers and DevOps teams to monitor applications performance using OpenTelemetry observability framework.
Uptrace is a source available OpenTelemetry APM built from the ground up to fully follow OpenTelemetry specification and guidelines.

What is OpenTelemetry?
OpenTelemetry is an open source project that provides a unified and vendor-neutral observability data format and APIs for modern cloud-native applications.
OpenTelemetry defines APIs and protocols for collecting telemetry data such as OpenTelemetry traces, OpenTelemetry metrics, and logs. You can Use OpenTelemetry to instrument your code and capture distributed traces and metrics. OpenTelemetry provides libraries for various programming languages and frameworks.
OpenTelemetry enables developers to better understand behavior of their applications and diagnose performance issues more easily.
How Uptrace works?
Uptrace stores telemetry data in a ClickHouse database. ClickHouse is an open source column-oriented database management system that is designed to process large volumes of data in real-time and to provide fast analytics and reporting capabilities.
Uptrace allows you to correlate distributed traces with metrics and logs, providing a complete view of your application's behavior.
Why Uptrace?
- Single UI for traces, metrics, and logs.
- Efficient ingestion: more than 10K spans / second on a single core.
- Excellent on-disk compression with ZSTD, for example, 1KB span can be compressed down to <40 bytes.
- S3 storage support with ability to automatically upload cold data to S3-like storage or HDD.
- Automatic alerts with notifications via email, Slack, Telegram, and more.
Best-in-class OpenTelemetry
Uptrace is fully compatible with OpenTelemetry and natively supports OpenTelemetry protocol (OTLP) either via gRPC (OTLP/gRPC) or HTTP (OTLP/HTTP) transports.
You can send OpenTelemetry data to Uptrace with these options:
Uptrace provides pre-configured OpenTelemetry SDKs for Go, Python, JavaScript, Ruby, Java, and PHP.
All-in-one APM
Uptrace is an all-in-one Application Performance Management (APM) tool that provides a single integrated user interface for traces, metrics, and logs. It helps identify performance bottlenecks in applications, such as slow database queries or unoptimized code.
Trace analysis provides a visual representation of how requests flow through the application, including how long each component takes to complete.
Uptrace's log management capabilities help to centralize, search, and analyze log data from different parts of the application.
Uptrace includes alerting features that can notify you when performance metrics exceed predefined thresholds or when anomalies are detected.
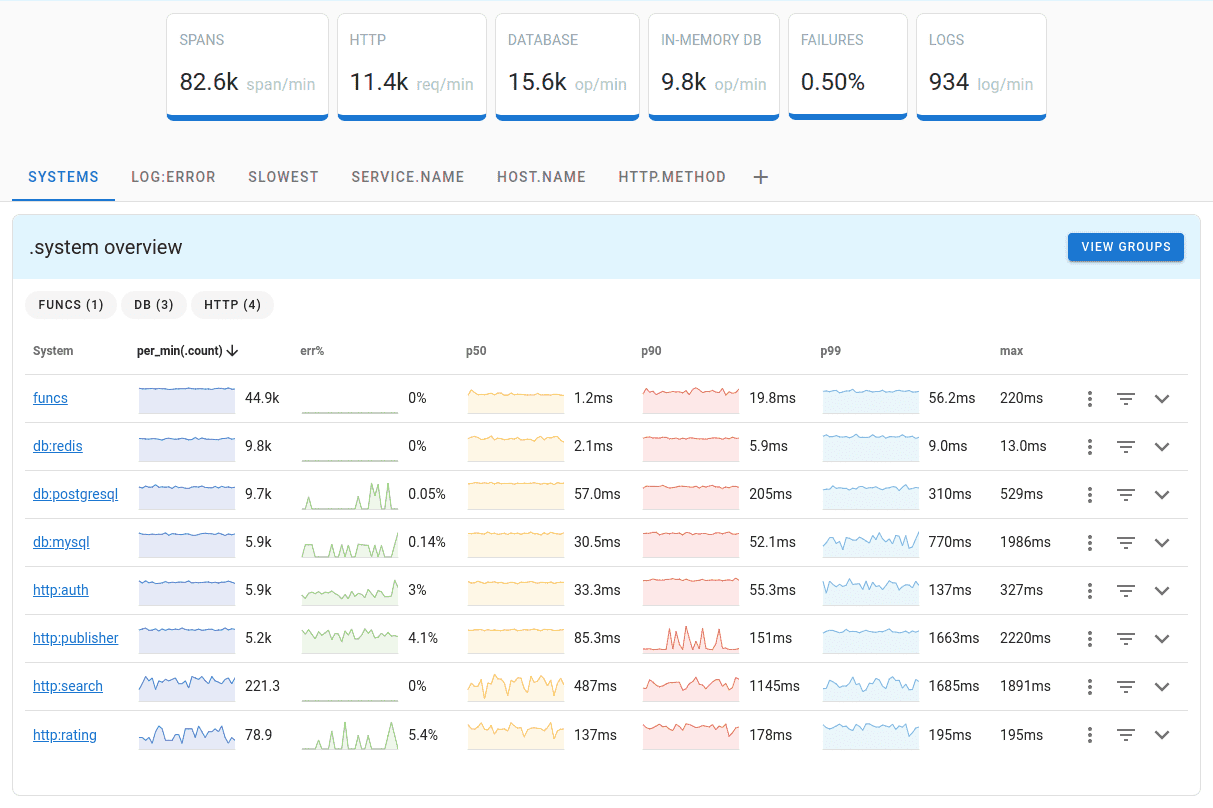
Uptrace allows to monitor your whole application stack on a compact and informative dashboard. You get a quick overview for all your services, hosts, and systems.

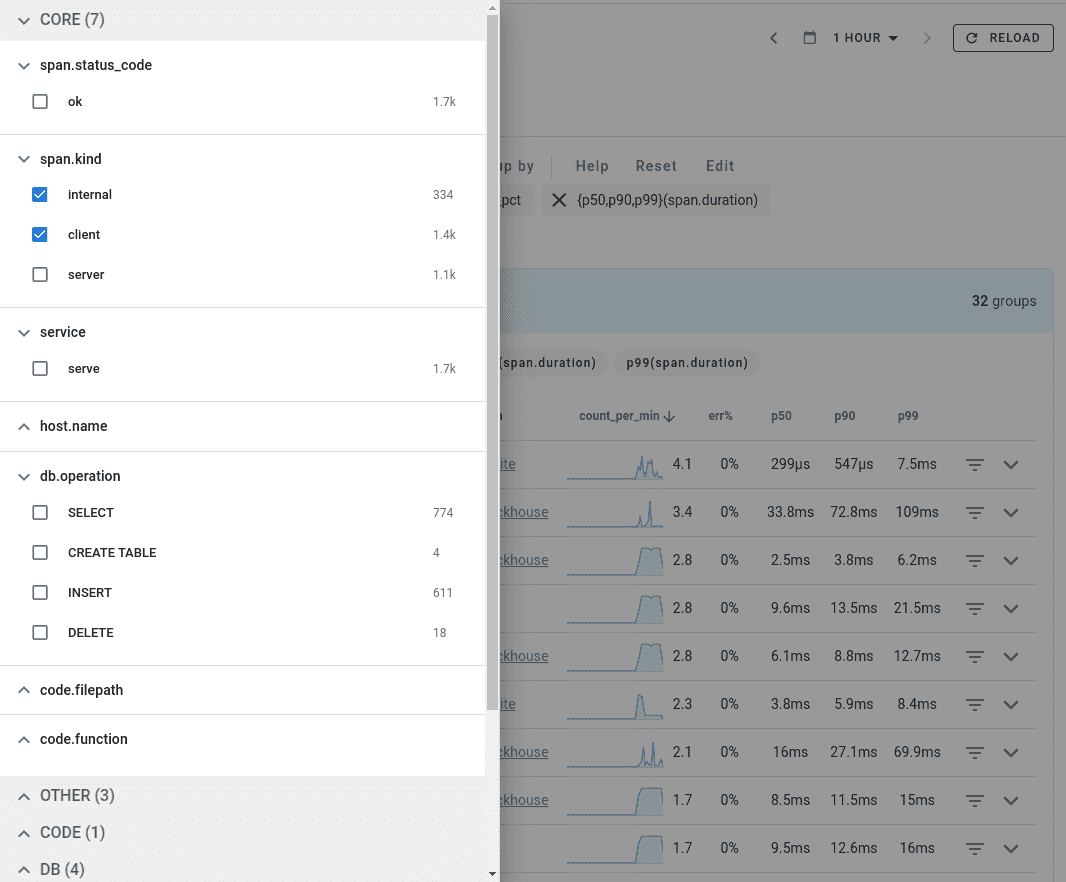
You can also analyze application performance with a fast and intuitive query language. You have the full power of SQL at your disposal to get deep insights from your data.

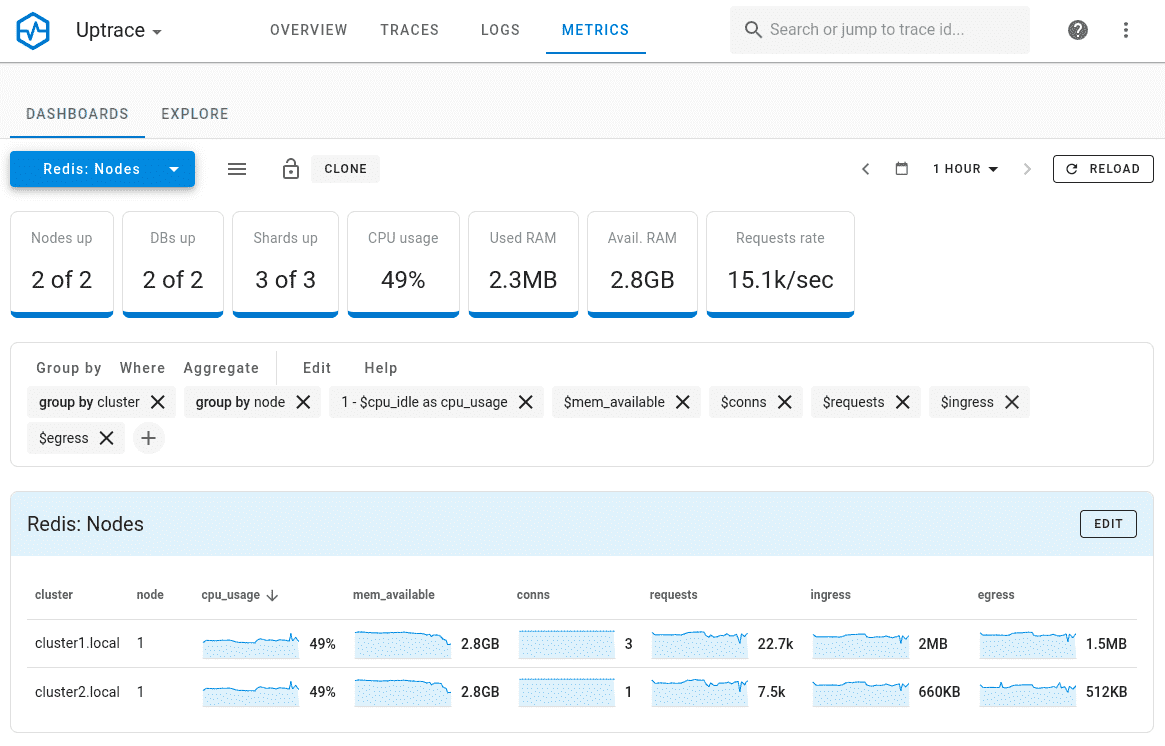
Fill the gaps left by tracing with modern metrics. Uptrace comes with pre-built dashboards for popular instrumentations and the ability to use Promql-like expressions to visualize metrics.

OpenTelemetry Demo
In less than 5 minutes, you try Uptrace with OpenTelemetry Astronomy Shop demo app, a microservice-based distributed system intended to illustrate the implementation of OpenTelemetry in a near real-world environment.
Step 1. Download the opentelemetry-demo using Git:
git clone https://github.com/uptrace/opentelemetry-demo.git
cd opentelemetry-demo
Step 2. Start the demo:
docker compose up --no-build
Step 3. Make sure Uptrace is running:
docker-compose logs uptrace
Step 4. Open Uptrace UI at http://localhost:14318/overview/2
If something is not working, check OpenTelemetry Collector logs:
docker-compose logs otelcol
Instrumentations
OpenTelemetry Instrumentations are plugins for popular frameworks and libraries that use OpenTelemetry API to record important operations, for example, HTTP requests, DB queries, logs, errors, and more.
You can check the following tutorials to get started with the most popular frameworks:
What's next?
In just a few minutes, you can try Uptrace by visiting the cloud demo (no login required) or running it locally with Docker. The source code is available on GitHub.